Minervini Trend Template Screener [LevelUp]The Minervini Trend Template is a stock screener based on the work of Mark Minervini, a two-time winner of the U.S. Investing Championship. The goal is to identify stocks that are in strong uptrends.
Historical analysis demonstrates that nearly all of the highest performing stocks exhibited a strong uptrend prior to making significant advances. Based on Mark's research, 99% of these stocks were trading above their 200-day simple moving average, and 96% were above their 50-day simple moving average, prior to becoming true market leaders.
🔹 Minervini Trend Template Requirements
✓ Price is above the 150-SMA and 200-SMA.
✓ 150-SMA is above the 200-SMA.
✓ 200-SMA is trending up for at least one month.
✓ 50-SMA is above the 150-SMA and the 200-SMA.
✓ Price is above the 50-SMA.
✓ Price is within 25% of the 52-week high.
✓ Price is 30%+ above the 52-week low.
🔹 Screening Features - Setting Your Search Criteria
There are various search options that can be customized.
▪ Symbol Type
The screener supports all equity types from stocks to ETFs to crypto. You can narrow the scope of your search by choosing only the symbol types of interest.
▪ Percent Change - Weekly, Monthly and YTD
Further narrow your search by specifying minimum percent changes on a weekly, monthly and/or year-to-date basis.
▪ Distance From 52-Week High
The screener looks for stocks within 25% of their 52-week high, as defined by Mark's Trend Template. You can further tighten this criteria by specifying a smaller percentage, for example, search for stocks within 5% of their 52-week high.
🔹 Installation And Usage
▪ Mark this indicator as a Favorite.
▪ Use the Pine Screener to search for stocks.
▪ Save the search results to a watchlist.
▪ View the watchlist in TradingView.
🔹 Note
The Trend Template as originally defined by Mark included an RS Rating based on a proprietary calculation from Investor's Business Daily. My preference in technical analysis and screening is to only use tools and calculations that can be researched and verified. There is no RS Rating requirement in this screener. All the other Trend Template requirements are included.
Screener

Swing Structure Scanner [LuxAlgo]The Swing Structure Scanner Indicator is a dashboard type indicator which displays a Consolidated "High/Low-Only" view of swing structure, with the capability to retrieve and display swing points from up to 6 different tickers and timeframes at once.
🔶 USAGE
This indicator displays swing structure data from up to 6 unique tickers or timeframes; Each graph represents the current swing structure retrieved from the requested chart/s.
Each swing graph displays the current live swing point positioning relative to the previous swing points. By analyzing the different formations, patterns can more easily be recognized and found across multiple tickers or timeframes at once.
This indicator serves as a nifty tool for confluence recognition, whether that's confluence throughout market tickers, or confluence through higher timeframes on the same ticker.
Alternatively, viewing the relative positioning of each swing point to each other, should give a clearer idea when higher lows or lower highs are formed. This can potentially indicate a newly forming trend, as well as serving as a warning to watch for breakouts.
The swing length can be changed to align with each individual's strategy, as well as a display look back can be adjusted to show more or less swing points at one time.
The display is fairly customizable, it is not fixed to 6 symbols at all times and can be minimized to only display the number of symbols needed; Additionally, the display can be set to vertical mode or horizontal(default) to utilize as needed.
Note: Hover over the swing point in the dashboard to get a readout of the exact price level of the swing point.
🔶 SETTINGS
Swing Length: Set the swing length for the structure calculations.
Swing Display Lookback: Sets the number of swing points (Pairs) to display in each Swing Graph display.
Symbols: Sets the Timeframe and Symbol for each Swing Graph.
Vertical Display: Display the Swing Graphs up and down, rather than side to side.
Scaling Factor: Scales the entire indicator up or down, to fit your needs.

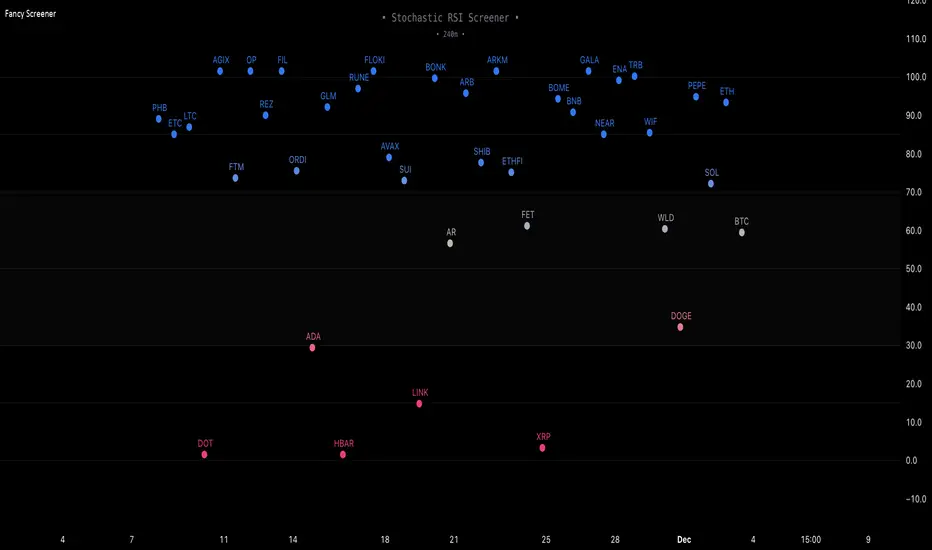
Fancy Oscillator Screener [Daveatt]⬛ OVERVIEW
Building upon LeviathanCapital original RSI Screener (), this enhanced version brings comprehensive technical analysis capabilities to your trading workflow. Through an intuitive grid display, you can monitor multiple trading instruments simultaneously while leveraging powerful indicators to identify market opportunities in real-time.
⬛ FEATURES
This script provides a sophisticated visualization system that supports both cross rates and heat map displays, allowing you to track exchange rates and percentage changes with ease. You can organize up to 40 trading pairs into seven customizable groups, making it simple to focus on specific market segments or trading strategies.
If you overlay on any circle/asset on the chart, you'll see the accurate oscillator value displayed for that asset
⬛ TECHNICAL INDICATORS
The screener supports the following oscillators:
• RSI - the oscillator from the original script version
• Awesome Oscillator
• Chaikin Oscillator
• Stochastic RSI
• Stochastic
• Volume Oscillator
• CCI
• Williams %R
• MFI
• ROC
• ATR Multiple
• ADX
• Fisher Transform
• Historical Volatility
• External : connect your own custom oscillator
⬛ DYNAMIC SCALING
One of the key improvements in this version is the implementation of dynamic chart scaling. Unlike the original script which was optimized for RSI's 0-100 range, this version automatically adjusts its scale based on the selected oscillator.
This adaptation was necessary because different indicators operate on vastly different numerical ranges - for instance, CCI typically ranges from -200 to +200, while Williams %R operates from -100 to 0.
The dynamic scaling ensures that each oscillator's data is properly displayed within its natural range, making the visualization both accurate and meaningful regardless of which indicator you choose to use.
⬛ ALERTS
I've integrated a comprehensive alert system that monitors both overbought and oversold conditions.
Users can now set custom threshold levels for their alerts.
When any asset in your monitored group crosses these thresholds, the system generates an alert, helping you catch potential trading opportunities without constant manual monitoring.
em will help you stay informed of market movements and potential trading opportunities.
I hope you'll find this tool valuable in your trading journey
All the BEST,
Daveatt
Linear Regression Channel Screener [Daveatt]Hello traders
First and foremost, I want to extend a huge thank you to @LonesomeTheBlue for his exceptional Linear Regression Channel indicator that served as the foundation for this screener.
Original work can be found here:
Overview
This project demonstrates how to transform any open-source indicator into a powerful multi-asset screener.
The principles shown here can be applied to virtually any indicator you find interesting.
How to Transform an Indicator into a Screener
Step 1: Identify the Core Logic
First, identify the main calculations of the indicator.
In our case, it's the Linear Regression
Channel calculation:
get_channel(src, len) =>
mid = math.sum(src, len) / len
slope = ta.linreg(src, len, 0) - ta.linreg(src, len, 1)
intercept = mid - slope * math.floor(len / 2) + (1 - len % 2) / 2 * slope
endy = intercept + slope * (len - 1)
dev = 0.0
for x = 0 to len - 1 by 1
dev := dev + math.pow(src - (slope * (len - x) + intercept), 2)
dev
dev := math.sqrt(dev / len)
Step 2: Use request.security()
Pass the function to request.security() to analyze multiple assets:
= request.security(sym, timeframe.period, get_channel(src, len))
Step 3: Scale to Multiple Assets
PineScript allows up to 40 request.security() calls, letting you monitor up to 40 assets simultaneously.
Features of This Screener
The screener provides real-time trend detection for each monitored asset, giving you instant insights into market movements.
It displays each asset's position relative to its middle regression line, helping you understand price momentum.
The data is presented in a clean, organized table with color-coded trends for easy interpretation.
At its core, the screener performs trend detection based on regression slope calculations, clearly indicating whether an asset is in a bullish or bearish trend.
Each asset's price is tracked relative to its middle regression line, providing additional context about trend strength.
The color-coded visual feedback makes it easy to spot changes at a glance.
Built-in alerts notify you instantly when any asset experiences a trend change, ensuring you never miss important market moves.
Customization Tips
You can easily expand the screener by adding more symbols to the symbols array, adapting it to your watchlist.
The regression parameters can be adjusted to match your preferred trading timeframes and sensitivity.
The alert system is already configured to notify you of trend changes, but you can customize the alert messages and conditions to your needs.
Limitations
While powerful, the screener is bound by PineScript's limitation of 40 security calls, capping the maximum number of monitored assets.
Using AI to Help With Conversion
An interesting tip:
You can use AI tools to help convert single-asset indicators to screeners.
Simply provide the original code and ask for assistance in transforming it into a screener format. While the AI output might need some syntax adjustments, it can handle much of the heavy lifting in the conversion process.
Prompt (example) : " Please make a pinescript version 5 screener out of this indicator below or in attachment to scan 20 instruments "
I prefer Claude AI (Opus model) over ChatGPT for pinescript.
Conclusion
This screener transformation technique opens up endless possibilities for market analysis.
By following these steps, you can convert any indicator into a powerful multi-asset scanner, enhancing your trading toolkit significantly.
Remember: The power of a screener lies not just in monitoring multiple assets, but in applying consistent analysis across your entire watchlist in real-time.
Feel free to fork and modify this screener for your own needs.
Happy trading! 🚀📈
Daveatt

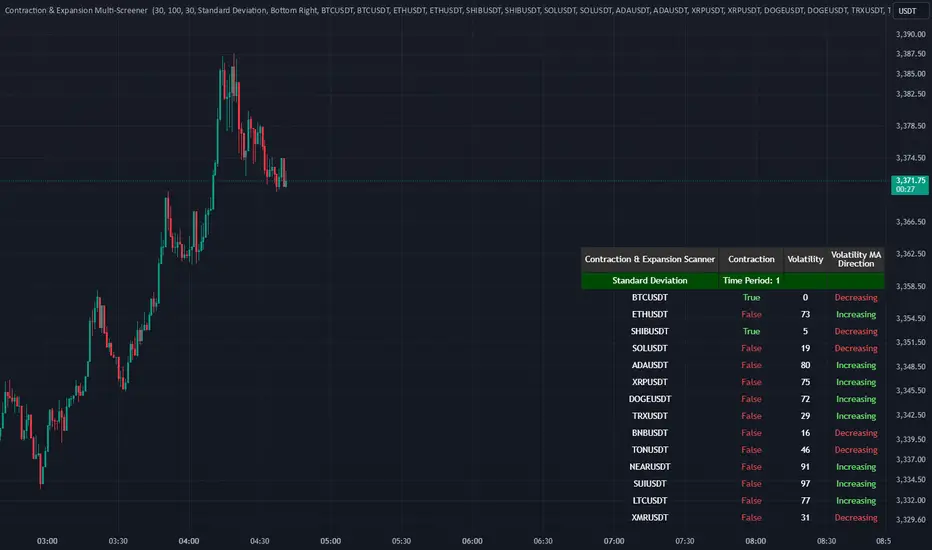
Contraction & Expansion Multi-Screener █ Overview:
The Contraction & Expansion Multi-Screener analyzes market volatility across many symbols. It provides insights into whether a market is contracting or expanding in volatility. With using a range of statistical models for modeling realized volatility, the script calculates, ranks, and monitors the degree of contraction or expansions in market volatility. The objective is to provide actionable insights into the current market phases by using historical data to model current volatility conditions.
This indicator accomplishes this by aggregating a variety of volatility measures, computing ranks, and applying threshold-based methods to identify transitions in market behavior. Volatility itself helps you understand if the market is moving a lot. High volatility or volatility that is increasing over time, means that the price is moving a lot. Volatility also mean reverts so if its extremely low, you can eventually expect it to return to its expected value, meaning there will be bigger price moves, and vice versa.
█ Features of the Indicator
This indicator allows the user to select up to 14 different symbols and retrieve their price data. There is five different types of volatility models that you can choose from in the settings of this indicator for how to use the screener.
Volatility Settings:
Standard Deviation
Relative Standard Deviation
Mean Absolute Deviation
Exponentially Weighted Moving Average (EWMA)
Average True Range (ATR)
Standard Deviation, Mean Absolute Deviation, and EWMA use returns to model the volatility, meanwhile Relative Standard Deviation uses price instead due to its geometric properties, and Average True Range for capturing the absolute movement in price. In this indicator the volatility is ranked, so if the volatility is at 0 or near 0 then it is contracting and the volatility is low. If the volatility is near 100 or at 100 then the volatility is at its maximum.
For traders that use the Forex Master Pattern Indicator 2 and want to use this indicator for that indicator, it is recommended to set your volatility type to Relative Standard Deviation.
Users can also modify the location of the screener to be on the top left, top right, bottom left, or bottom right. You also can disable sections of the screener and show a smaller list if you want to.
The Contraction & Expansion Screener shows you the following information:
Confirmation of whether or not there is a contraction or expansion
Percentage Rank of the volatility
Volatility MA direction: This screener uses moving averages on the volatility to determine if its increasing over time or decreasing over time.
Flag Screener [QuantVue]Flag Screener is a screening tool that identify bull and bear flags in up to 40 different symbols.
The indicator takes a comma separated list of symbols and then scans the symbols in real time to detect bull or bear flags.
What are flags
Flags are continuation patterns that occur within the general trend of the security. A bull flag represents a temporary pause or consolidation before price resumes it's upward movement, while a bear flag occurs before price continues its downward movement.
Both flag patterns consist of two components:
The Pole
The Flag
The pole is the initial strong upward surge or decline that precedes the flag. The pole is usually a fast move accompanied by heavy volume signaling significant buying or selling pressure.
The flag is then formed as price consolidates after the initial surge or decline from the pole. For a bull flag price will drift slightly downward to sideways, a bear flag will drift upward to sideways. The best flags often see volume dry up during this phase of the pattern.
Indicator Settings
Both components are fully customizable in the indicator so the user can adjust for any time frame or volatility. Select the minimum and maximum accepted limits from the % gain loss required for the pole, the maximum acceptable flag depth or rally and the minimum and maximum number of bars for each component.

Enhanced Pressure MTF ScreenerEnhanced Pressure Multi-Timeframe (MTF) Screener Indicator
Overview
The Enhanced Pressure MTF Screener is an add-on that extends the capabilities of the Enhanced Buy/Sell Pressure, Volume, and Trend Bar Analysis . It provides a clear and consolidated view of buy/sell pressure across multiple timeframes. This indicator allows traders to determine when different timeframes are synchronized in the same trend direction, which is particularly useful for making high-confidence trading decisions.
Image below: is the Enhanced Buy/Sell Pressure, Volume, and Trend Bar Analysis with the Enhanced Pressure MTF Screener indicator both active together.
Key Features
1.Multi-Timeframe Analysis
The indicator screens various predefined timeframes (from 1 week down to 10 minutes).
It offers a table view that shows buy or sell ratings for each timeframe, making it easy to see which timeframes are aligned.
Traders can choose which timeframes to include based on their trading strategies (e.g., higher timeframes for position trading, lower timeframes for scalping).
2.Pressure and Trend Calculation
Uses Buy and Sell Pressure calculations from the Enhanced Buy/Sell Pressure indicator to determine whether buying or selling is dominant in each timeframe.
By analyzing pressures on multiple timeframes, the indicator gives a comprehensive perspective of the current market sentiment.
The indicator calculates whether a move is strong based on user-defined thresholds, which are displayed in the form of additional signals.
3.Heikin Ashi Option
The Heikin Ashi candle type can be toggled on or off. Using Heikin Ashi helps smooth out market noise and provides a clearer indication of trend direction.
This is particularly helpful for traders who want to filter out market noise and focus on the primary trend.
4.Table Customization
Table Positioning: The table showing timeframe data can be positioned at different locations on the chart—top, middle, or bottom.
Text and Alignment: The alignment and text size of the table can be customized for better visual clarity.
Color Settings: Users can choose specific colors to indicate buying and selling pressure across timeframes, making it easy to interpret.
5.Strong Movement Indicators
The screener provides an additional visual cue (🔥) for timeframes where the movement is deemed strong, based on a user-defined threshold.
This helps highlight timeframes where significant buying or selling pressure is present, which could signal potential trading opportunities.
How the Screener Works
1.Pressure Calculation
For each selected timeframe, the indicator retrieves the Open, High, Low, and Close (OHLC) values.
It calculates buy pressure (the range between high and low when the closing price is higher than the opening) and sell pressure (the range between high and low when the closing price is equal to or lower than the opening).
The screener computes the pressure ratio, which represents the difference between buying and selling pressure, to determine which side is dominant.
2.Trend Rating and Signal Generation
Based on the calculated pressure, the screener determines a trend rating for each timeframe: "Buy," "Sell," or "Neutral." (▲ ,▼ or •)
Additionally, it generates a signal (▲ or ▼) to indicate the current trend direction and whether the move is strong (based on the user-defined threshold).
If the movement is strong, a fire icon (🔥) is added to indicate that there is significant pressure on that timeframe, signaling a higher confidence in the trend.
3.Customizable Strong Move Thresholds
Strong Move Threshold: The screener uses this value to decide whether a trend is significantly strong. A higher value makes it more selective in determining strong moves.
Strong Movement Threshold: Helps determine when an additional strong signal should be displayed, offering further insight into the strength of market movement.
Inputs and Customization
The Enhanced Pressure MTF Screener is highly customizable to fit the needs of individual traders:
General Settings:
Use Heikin Ashi: Toggle this setting to use Heikin Ashi for a smoother trend representation.
Strong Move Threshold: Defines how strong a move should be to be considered significant.
Strong Movement Threshold: Specifies the level of pressure required to highlight a move with the fire icon.
Table Settings:
Position: Choose the vertical position of the screener table (top, middle, or bottom of the chart).
Alignment: Align the table (left, center, or right) to best suit your chart layout.
Text Size: Adjust the text size in the table for better readability.
Table Color Settings:
Users can set different colors to represent buying and selling signals for better visual clarity, particularly when scanning multiple timeframes.
Timeframe Settings:
The screener provides options to include up to ten different timeframes. Traders can select and customize each timeframe to match their strategy.
Examples of available timeframes include 1 Week, 1 Day, 12 Hours, down to 10 Minutes, allowing for both broad and detailed analysis.
Practical Use Case
Identifying Trend Alignment Across Timeframes:
Imagine you are about to take a long trade but want to make sure that the trend direction is aligned across multiple timeframes.
The screener displays "Buy" ratings across the 4H, 1H, 30M, and 10M timeframes, while higher timeframes (like 1W and 1D) also show "Buy" with strong signals (🔥). This indicates that buying pressure is strong across the board, adding confidence to your trade.
Spotting Reversal Opportunities:
If a downtrend is evident across most timeframes but suddenly a higher timeframe, such as 12H, changes to "Buy" while showing a strong move (🔥), this could indicate a potential reversal.
The screener allows you to spot these discrepancies and consider taking early action.
Benefits for Traders
1.Synchronization Across Timeframes:
One of the main strengths of this screener is its ability to show synchronized buy/sell signals across different timeframes. This makes it easy to confirm the strength and consistency of a trend.
For example, if you see that all the selected timeframes display "Buy," this implies that both short-term and long-term traders are favoring the upside, giving additional confidence to go long.
2.Quick and Visual Trend Overview:
The table offers an at-a-glance summary, reducing the time required to manually inspect each timeframe.
This makes it particularly useful for traders who want to make quick decisions, such as day traders or scalpers.
3.Strong Move Indicator:
The use of fire icons (🔥) provides an easy way to identify significant movements. This is particularly helpful for traders looking for breakouts or strong market conditions that could lead to high probability trades.
To put it short or to summarize
The Enhanced Pressure MTF Screener is a powerful add-on for traders looking to understand how buy and sell pressure aligns across multiple timeframes. It offers:
A clear summary of buying or selling pressure across different timeframes.
Heikin Ashi smoothing, providing an option to reduce market noise.
Strong movement signals to highlight significant trading opportunities.
Customizable settings to fit any trading strategy or style.
The screener and the main indicator are best used together, as the screener provides the multi-timeframe overview, while the main indicator provides an in-depth look at each individual bar and trend.
I hope my indicator helps with your trading, if you guys have any ideas or questions there is the comment section :D

Divergence for Many Indicators v4 Screener▋ INTRODUCTION:
The “Divergence for Many Indicators v4 Screener” is developed to provide an advanced monitoring solution for up to 24 symbols simultaneously. It efficiently collects signals from multiple symbols based on the “ Divergence for Many Indicators v4 ” and presents the output in an organized table. The table includes essential details starting with the symbol name, signal price, corresponding divergence indicator, and signal time.
_______________________
▋ CREDIT:
The divergence formula adapted from the “ Divergence for Many Indicators v4 ” script, originally created by @LonesomeTheBlue . Full credit to his work.
_______________________
▋ OVERVIEW:
The chart image can be considered an example of a recorded divergence signal that occurred in $BTCUSDT.
_______________________
▋ APPEARANCE:
The table can be displayed in three formats:
1. Full indicator name.
2. First letter of the indicator name.
3. Total number of divergences.
_______________________
▋ SIGNAL CONFIRMATION:
The table distinguishes signal confirmation by using three different colors:
1. Not-Confirmed (Orange): The signal is not confirmed yet, as the bar is still open.
2. Freshly Confirmed (Green): The signal was confirmed 1 or 2 bars ago.
3. Confirmed (Gray): The signal was confirmed 3 or more bars ago.
_______________________
▋ INDICATOR SETTINGS:
Section(1): Table Settings
(1) Table location on the chart.
(2) Table’s cells size.
(3) Chart’s timezone.
(4) Sorting table.
- Signal: Sorts the table by the latest signals.
- None: Sorts the table based on the input order.
(5) Table’s colors.
(6) Signal Confirmation type color. Explained above in the SIGNAL CONFIRMATION section
Section(2): Divergence for Many Indicators v4 Settings
As seen on the Divergence for Many Indicators v4
* Explained above in the APPEARANCE section
Section(3): Symbols
(1) Enable/disable symbol in the screener.
(2) Entering a symbol.
_______________________
▋ FINAL COMMENTS:
For best performance, add the Screener indicator to an active symbol chart, such as QQQ, SPY, AAPL, BTCUSDT, ES, EURUSD, etc., and avoid mixing symbols from different market allocations.
The Divergence for Many Indicators v4 Screener indicator is not a primary tool for making trading decisions.

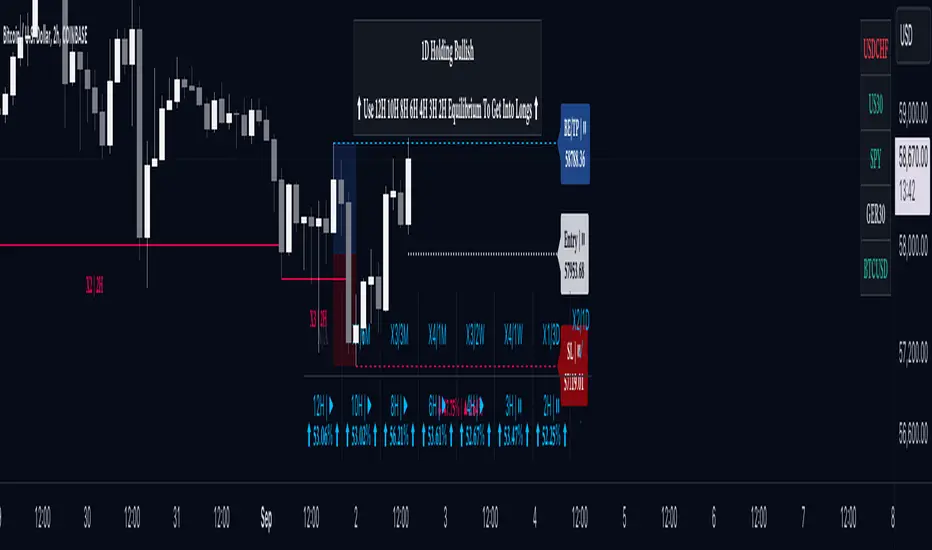
Screener | FractalystWhat’s the purpose of this indicator?
This indicator is part of the Optirange suite , which analyzes all timeframes using a mechanical top-down approach to determine the overall market bias. It helps you identify the specific timeframes and exact levels for positioning in longs, shorts, or guiding you on whether to stay away from trading a particular market condition.
The purpose of the Screener indicator is to track the contextual bias of multiple markets simultaneously on the charts without the need to switch between pairs. This allows traders to monitor various assets in real-time, enhancing decision-making efficiency and identifying potential trading opportunities more effectively.
-----
How does this indicator identify the overall market bias?
This indicator employs a systematic top-down approach, analyzing market structure, fractal blocks, and their mitigations from the 12M timeframe down to the 1D timeframe to uncover the story behind the market. This method helps identify the overall market bias, whether it’s bullish, bearish, or in consolidating conditions.
Below is a flowchart that illustrates the calculation behind the market context identification, demonstrating the systematic approach:
-----
According to the above trade plan, why do we only look for mitigations within Fractal Blocks of X1/X2?
In this context, "X" stands for a break in the market's structure, and the numbers (1 and 2) indicate the sequence of these breaks within the same trend direction, either up or down.
We focus on mitigations within Fractal Blocks during the X1/X2 stages because these points mark the early phase (X1) and the continuation (X2) of a trend. By doing so, we align our trades with the market's main direction and avoid getting stopped out in the middle of trends.
-----
How does this indicator identify ranges in a mechanical way?
Since the indicator is part of the Optirange suite , it follows the exact rules that Optirange utilizes to identify breaks of market structures in a mechanical manner.
Let’s take a closer look at how the ranges are calculated:
1- First, we need to understand the importance of following a set of mechanical rules in identifying market structure:
The image above illustrates the difference between a subjective and a mechanical approach to analyzing market structure. The subjective method often leads to uncertainty, where traders might struggle to pinpoint exact breaks in structure, resulting in inconsistent decision-making. Questions like “Is this a break?” or “Maybe this one...?” reflect the ambiguity of manual interpretation, which can cause confusion and errors in trading.
On the other hand, the mechanical approach depicted on the right side of the image follows a clear, rule-based method to define breaks in market structure. This systematic approach eliminates guesswork by providing precise criteria for identifying structural changes, such as marking structural invalidation levels where market bias shifts from bullish to bearish or vice versa. The mechanical method not only offers consistency but also integrates statistical probabilities , enhancing the trader's ability to make data-driven decisions.
By adhering to these mechanical rules, the Screener indicator ensures that ranges are identified consistently, allowing traders to rely on objective analysis rather than subjective interpretation . This approach is crucial for accurately defining market structures and making informed trading decisions.
2- Now let's take a look at a practical example of how the indicator utilizes Pivot points with a period of 2 to identify ranges:
In this image, we see a Bearish Scenario on the left and a Bullish Scenario on the right. The indicator starts by identifying the first significant swing on the chart. It then validates this swing by checking if there is a preceding swing high (for a bearish scenario) or swing low (for a bullish scenario). Once validated, the indicator confirms a break of structure when price closes below or above these points, respectively.
For instance, in the Bearish Scenario:
The first significant swing is identified.
The script checks for a preceding swing high before confirming any structural break.
A candle closure below the swing low confirms the first bearish break of structure.
This results in a confirmed market bias towards bearishness, with structural liquidity levels indicated for potential price targets.
In the Bullish Scenario:
The process is mirrored, identifying the first swing low and validating it with a preceding swing low.
A closure above this swing confirms the bullish break of structure.
This leads to a market bias towards bullishness, with invalidation levels to watch if the trend shifts.
This practical example demonstrates how the indicator systematically identifies market ranges, ensuring that traders can make informed decisions based on clear, rule-based criteria.
-----
How does this indicator identify ranges in a mechanical way, What are the underlying calculations?
Fractal blocks refer to the most extreme swing candle within the latest break. They can serve as significant levels for price rejection and may guide movements toward the next break, often in confluence with topdown analysis for added confirmation.
-----
What are mitigations, What are the underlying calculations?
Mitigations refer to specific price action occurrences identified by the script:
1- When the price reaches the most recent fractal block and confirms a swing candle, the script automatically draws a line from the swing to the fractal block bar and labels it with a checkmark.
2- If the price wicks through the invalidation level and then retraces back to the fractal block while forming a swing candle, the script labels this as a double mitigation on the chart.
This level will serve as the next potential invalidation level if a break occurs in the same direction.
-----
What does the right table display?
The table located at the right of your chart displays five colored symbols that represent the contextual market bias:
Green: The market is in a bullish condition.
Red: The market is in a bearish condition.
White: The market condition is uncertain, and it is advisable to stay away from trading.
-----
What does the bottom table display?
The bottom table can be turned on in the Optirange indicator and serves multiple purposes:
Range Counts and Mitigations: It shows the range counts and their mitigations across multiple timeframes, providing a comprehensive view of market dynamics.
Hourly Timeframe Probabilities: The bottom row of the bias table displays the probabilities for various hourly timeframes, helping to identify potential entry levels based on the multi-timeframe bias determined by the Screener.
In a bullish market context, you should look for long positions by focusing on hourly timeframes where buy-side probability exceeds 50%.
In a bearish market context, you should look for short positions by focusing on hourly timeframes where the sell-side probability exceeds 50%.
When the symbol is white within the Screener table, it signals that the market bias is unclear, and it's recommended to stay away from trading in such conditions.
-----
How the range probabilities are calculated?
Each break of market structure, denoted as X, is assigned a unique ID, starting from X1 for the first break, X2 for the second, and so on.
The probabilities are calculated based on breaks holding, meaning price closing through the liquidity level, rather than invalidation. This probability is then divided by the total count of similar numeric breaks.
For example, if 75 out of 100 bullish X1s become X2, then the probability of X1 becoming X2 on your charts will be displayed as 75% in the following format: ⬆ 75%
-----
What does the top table display?
The top table on the charts displays the current market context, offering insights into the underlying bias. It highlights the high-timeframe (HTF) bias and guides you on which timeframes you should use to enter long or short positions, based on the probability of success.
Additionally, when the market bias is unclear, the table clearly signals that it's best to avoid trading that specific market until the context or market story becomes clearer. This helps traders make informed decisions and avoid uncertain market conditions.
-----
How does the Screener indicator identify the market bias/context/story ?
- Market Structure: The Optirange indicator analyzes market structure across multiple timeframes, from a top-down perspective, including 12M, 6M, 3M, 1M, 2W, 1W, 3D, and 1D.
- Fractal Blocks: Once the market structure or current range is identified, the indicator automatically identifies the last push before the break and draws it as a box. These zones acts as a key area where the price often rejects from.
- Mitigations: After identifying the Fractal Block, the indicator checks for price mitigation or rejection within this zone. If mitigation occurs, meaning the price has reacted or rejected from the Fractal Block, the indicator draws a checkmark from the deepest candle within the Fractal Block to the initial candle that has created the zone.
- Bias Table: After identifying the three key elements—market structure, Fractal Blocks, and price mitigations—the indicator compiles this information into a multi-timeframe table. This table provides a comprehensive top-down perspective, showing what is happening from a structural standpoint across all timeframes. The Bias Table presents raw data, including identified Fractal Blocks and mitigations, to help traders understand the overall market trend. This data is crucial for the screener, which uses it to determine the current market bias based on a top-down analysis.
- Screener: Once all higher timeframes (HTF) and lower timeframes (LTF) are calculated using the indicator, it follows the exact rules outlined in the flowchart to determine the market bias. This systematic approach not only helps identify the current market trend but also suggests the exact timeframes to use for finding entry, particularly on hourly timeframes.
Example:
12M Timeframe:
OANDA:EURUSD
6M Timeframe :
OANDA:EURUSD
3M Timeframe :
OANDA:EURUSD
1M Timeframe :
OANDA:EURUSD
2W Timeframe :
OANDA:EURUSD
1W Timeframe :
OANDA:EURUSD
-----
User-input settings and customizations
Terms and Conditions | Disclaimer
Our charting tools are provided for informational and educational purposes only and should not be construed as financial, investment, or trading advice. They are not intended to forecast market movements or offer specific recommendations. Users should understand that past performance does not guarantee future results and should not base financial decisions solely on historical data. By utilizing our charting tools, the buyer acknowledges that neither the seller nor the creator assumes responsibility for decisions made using the information provided. The buyer assumes full responsibility and liability for any actions taken and their consequences, including potential financial losses. Therefore, by purchasing these charting tools, the customer acknowledges that neither the seller nor the creator is liable for any unfavorable outcomes resulting from the development, sale, or use of the products.
The buyer is responsible for canceling their subscription if they no longer wish to continue at the full retail price. Our policy does not include reimbursement, refunds, or chargebacks once the Terms and Conditions are accepted before purchase.
By continuing to use our charting tools, the user acknowledges and accepts the Terms and Conditions outlined in this legal disclaimer.
Options Screener [Pro] - IVRank, IVx, Deltas, Exp.move, Skew
𝗢𝗽𝘁𝗶𝗼𝗻 𝘀𝗰𝗿𝗲𝗲𝗻𝗲𝗿 𝗼𝗻 𝗧𝗿𝗮𝗱𝗶𝗻𝗴𝗩𝗶𝗲𝘄 𝘄𝗶𝘁𝗵 𝗿𝗲𝗮𝗹 𝗱𝗮𝘁𝗮, 𝗮𝘃𝗮𝗶𝗹𝗮𝗯𝗹𝗲 𝗳𝗼𝗿 𝗼𝘃𝗲𝗿 𝟭𝟱𝟬+ 𝗹𝗶𝗾𝘂𝗶𝗱 𝗨𝗦 𝗺𝗮𝗿𝗸𝗲𝘁 𝘀𝘆𝗺𝗯𝗼𝗹𝘀!
𝗢𝘂𝗿 𝘀𝗰𝗿𝗲𝗲𝗻𝗲𝗿 𝗽𝗿𝗼𝘃𝗶𝗱𝗲𝘀 𝗲𝘀𝘀𝗲𝗻𝘁𝗶𝗮𝗹 𝗸𝗲𝘆 𝗺𝗲𝘁𝗿𝗶𝗰𝘀 𝘀𝘂𝗰𝗵 𝗮𝘀:
✅ IVRank
✅ IVx
✅ 5-Day IVx Change
✅ Vertical Pricing Skew
✅ Horizontal IVx Skew
✅ Delta Skew
like TastyTrade, TOS, IBKR etc.
Designed to help you assess option market conditions and make well-informed trading decisions, this tool is an essential addition for every serious options trader!
Ticker Information:
This screener is currently implemented for more than 150 liquid US market tickers and we are continuously expanding the list:
SP:SPX AMEX:SPY NASDAQ:QQQ NASDAQ:TLT AMEX:GLD
NYSE:AA NASDAQ:AAL NASDAQ:AAPL NYSE:ABBV NASDAQ:ABNB NASDAQ:AMD NASDAQ:AMZN AMEX:ARKK NASDAQ:AVGO NYSE:AXP NYSE:BA NYSE:BABA NYSE:BAC NASDAQ:BIDU AMEX:BITO NYSE:BMY NYSE:BP NASDAQ:BYND NYSE:C NYSE:CAT NYSE:CCJ NYSE:CCL NASDAQ:COIN NYSE:COP NASDAQ:COST NYSE:CRM NASDAQ:CRWD NASDAQ:CSCO NYSE:CVNA NYSE:CVS NYSE:CVX NYSE:DAL NASDAQ:DBX AMEX:DIA NYSE:DIS NASDAQ:DKNG NASDAQ:EBAY NASDAQ:ETSY NASDAQ:EXPE NYSE:F NYSE:FCX NYSE:FDX AMEX:FXI AMEX:GDX AMEX:GDXJ NYSE:GE NYSE:GM NYSE:GME NYSE:GOLD NASDAQ:GOOG NASDAQ:GOOGL NYSE:GPS NYSE:GS NASDAQ:HOOD NYSE:IBM NASDAQ:IEF NASDAQ:INTC AMEX:IWM NASDAQ:JD NYSE:JNJ NYSE:JPM NYSE:JWN NYSE:KO NYSE:LLY NYSE:LOW NYSE:LVS NYSE:MA NASDAQ:MARA NYSE:MCD NYSE:MET NASDAQ:META NYSE:MGM NYSE:MMM NYSE:MPC NYSE:MRK NASDAQ:MRNA NYSE:MRO NASDAQ:MRVL NYSE:MS NASDAQ:MSFT AMEX:MSOS NYSE:NCLH NASDAQ:NDX NYSE:NET NASDAQ:NFLX NYSE:NIO NYSE:NKE NASDAQ:NVDA NASDAQ:ON NYSE:ORCL NYSE:OXY NASDAQ:PEP NYSE:PFE NYSE:PINS NYSE:PLTR NASDAQ:PTON NASDAQ:PYPL NASDAQ:QCOM NYSE:RBLX NYSE:RCL NASDAQ:RIOT NASDAQ:RIVN NASDAQ:ROKU NASDAQ:SBUX NYSE:SHOP AMEX:SLV NASDAQ:SMCI NASDAQ:SMH NYSE:SNAP NYSE:SQ NYSE:T NYSE:TGT NASDAQ:TQQQ NASDAQ:TSLA NYSE:TSM NASDAQ:TTD NASDAQ:TXN NYSE:U NASDAQ:UAL NYSE:UBER AMEX:UNG NYSE:UPS NASDAQ:UPST AMEX:USO NYSE:V AMEX:VXX NYSE:VZ NASDAQ:WBA NYSE:WFC NYSE:WMT NASDAQ:WYNN NYSE:X AMEX:XHB AMEX:XLE AMEX:XLF AMEX:XLI AMEX:XLK AMEX:XLP AMEX:XLU AMEX:XLV AMEX:XLY NYSE:XOM NYSE:XPEV CBOE:XSP NASDAQ:ZM
How does the screener work and why is it unique?
This Pine Script screener is an expert tool created to provide various option metrics and visualization tools for options market traders. The screener extracts raw options data from an external data provider (ORATS), processes, and refines the delayed data package using pineseed, and sends it to TradingView. The data is calculated using specific formulas or interpolated values, such as delta distances. This method of integrating options data into a screener framework is unique and innovative on TradingView.
The screener aims to offer a comprehensive view of the current state of options for the implemented instruments, including implied volatility index (IVx), IV rank (IVR), options skew, and expected market movements, which are objectively measured as detailed below.
The options metrics displayed may be familiar to options traders from various major brokerage platforms such as TastyTrade, IBKR, TOS, Tradier, TD Ameritrade, Schwab, etc.
🟨 𝗗𝗘𝗧𝗔𝗜𝗟𝗘𝗗 𝗗𝗢𝗖𝗨𝗠𝗘𝗡𝗧𝗔𝗧𝗜𝗢𝗡 🟨
~~~~~~~~~~~~~~~~~~~~~~~~~~~~~~~~~~~~~~~~~~~~~~~~~~
~~~~~~~~~~~~~~~~~~~~~~~~~~~~~~~~~~~~~~~~~~~~~~~~~~
🔶 Auto-Updating Option Metrics
~~~~~~~~~~~~~~~~~~~~~~~~~~~~~~~~~~~~~~~~~~~~~~~~~~
~~~~~~~~~~~~~~~~~~~~~~~~~~~~~~~~~~~~~~~~~~~~~~~~~~
🔹 IVR (IV Rank)
The Implied Volatility Rank (IVR) indicator helps options traders assess the current level of implied volatility (IV) in comparison to the past 52 weeks. IVR is a useful metric to determine whether options are relatively cheap or expensive. This can guide traders on whether to buy or sell options. We calculate IVrank, like TastyTrade does.
IVR Calculation: IV Rank = (current IV - 52 week IV low) / (52 week IV high - 52 week IV low)
IVR Levels and Interpretations:
IVR 0-10 (Green): Very low implied volatility rank. Options might be "cheap," potentially a good time to buy options.
IVR 10-35 (White): Normal implied volatility rank. Options pricing is relatively standard.
IVR 35-50 (Orange): Almost high implied volatility rank.
IVR 50-75 (Red): Definitely high implied volatility rank. Options might be "expensive," potentially a good time to sell options for higher premiums.
IVR above 75 (Highlighted Red): Ultra high implied volatility rank. Indicates very high levels, suggesting a favorable time for selling options.
Extra: If the IVx value is also greater than 30, the background will be dark highlighted, because a high IVR alone doesn’t mean much without high IVx.
🔹IVx (Implied Volatility Index)
The Implied Volatility Index (IVx) displayed in the option chain is calculated similarly to the VIX. The Cboe employs standard and weekly SPX options to measure the expected volatility of the S&P 500. A similar method is utilized to calculate IVx for each option expiration cycle.
For our purposes, we aggregate the IVx values specifically for the 35-70 day monthly expiration cycle . This aggregated value is then presented in the screener and info panel, providing a clear and concise measure of implied volatility over this period.
We will display a warning if the option chain is heavily skewed and valid, symmetric 16 delta options are not found at optimal monthly expirations.
IVx Color coding:
IVx above 30 is displayed in orange.
IVx above 60 is displayed in red
Important Note: The IVx value alone does not provide sufficient context. There are stocks that inherently exhibit high IVx values. Therefore, it is crucial to consider IVx in conjunction with the Implied Volatility Rank (IVR), which measures the IVx relative to its own historical values. This combined view helps in accurately assessing the significance of the IVx in relation to the specific stock's typical volatility behavior.
This indicator offers traders a comprehensive view of implied volatility, assisting them in making informed decisions by highlighting both the absolute and relative volatility measures.
🔹IVx 5 days change %
We are displaying the five-day change of the IV Index (IVx value). The IV Index 5-Day Change column provides quick insight into recent expansions or decreases in implied volatility over the last five trading days.
Traders who expect the value of options to decrease might view a decrease in IVX as a positive signal. Strategies such as Strangle and Ratio Spread can benefit from this decrease.
On the other hand, traders anticipating further increases in IVX will focus on the rising IVX values. Strategies like Calendar Spread or Diagonal Spread can take advantage of increasing implied volatility.
This indicator helps traders quickly assess changes in implied volatility, enabling them to make informed decisions based on their trading strategies and market expectations.
🔹 Vertical Pricing Skew
At TanukiTrade, Vertical Pricing Skew refers to the difference in pricing between put and call options with the same expiration date at the same distance (at expected move). We analyze this skew to understand market sentiment. This is the same formula used by TastyTrade for calculations.
PUT Skew (red): Put options are more expensive than call options, indicating the market expects a downward move (▽). If put options are more expensive by more than 20% at the same expected move distance, we color it lighter red.
CALL Skew (green): Call options are more expensive than put options, indicating the market expects an upward move (△). If call options are priced more than 30% higher at the examined expiration, we color it lighter green.
We focus on options with 35-70 days to expiration (DTE) for optimal analysis. We always evaluate the skew at the expected move using linear interpolation to determine the theoretical pricing of options. If the pricing have more than C50%/P35% we are highlighting the cell.
This approach helps us gauge market expectations accurately, providing insights into potential price movements.
🔹 Horizontal IVx Skew
In options pricing, it is typically expected that the implied volatility (IVx) increases for options with later expiration dates. This means that options further out in time are generally more expensive. At TanukiTrade, we refer to the phenomenon where this expectation is reversed—when the IVx decreases between two consecutive expirations—as Horizontal Skew or IVx Skew.
Horizontal IVx Skew occurs when: Front Month IVx < Back Month IVx
This scenario can create opportunities for traders who prefer diagonal or calendar strategies. Based on our experience, we categorize Horizontal Skew into two types:
Weekly Horizontal Skew: When IVx skew is observed between two consecutive non-monthly expirations , the displayed value is the rounded-up percentage difference. On hover, the approximate location of this skew is also displayed. The precise location can be seen on the Overlay indicator.
Monthly Horizontal Skew: When IVx skew is observed between two consecutive monthly expirations , the displayed value is the rounded-up percentage difference. On hover, the approximate location of this skew is also displayed. The precise location can be seen on the Overlay indicator.
The Monthly Vertical IVx skew is consistently stronger (more liquid) on average symbols than the weekly vertical IVx skew. Weekly Horizontal IVx Skew may not carry relevant information for symbols not included in the 'Weeklies & Volume Masters' preset.
If the options chain follows the normal IVx pattern, no skew value is displayed.
Additionally , if the Implied Volatility Rank (IVR) is low (indicated by green), the Horizontal Skew background turns black, because this environment is good for Calendar+Diagonal.
Additionally , if the % of the skew is greater than 10, the Horizontal Skew font color turns lighter.
🔹 Delta Skew 🌪️ (Twist)
We have a metric that examines which monthly expiration indicates a "Delta Skew Twist" where the 16 delta deviates from the monthly STD. This is important because, under normal circumstances, the 16 delta is positioned between the expected move and the standard deviation (STD1) line. However, if the interpolated 16 delta line exceeds the STD1 line either upwards or downwards, it represents a special case of vertical skew.
Normal case : exp.move < delta16 < std1
Delta Skew Twist: exp.move < std1 < delta16
If the Days to Expiration of the twist is less than 75, we use a lighter color.
~~~~~~~~~~~~~~~~~~~~~~~~~~~~~~~~~~~~~~~~~~~~~~~~~~
~~~~~~~~~~~~~~~~~~~~~~~~~~~~~~~~~~~~~~~~~~~~~~~~~~
🔶 HOW WE CALCULATE
~~~~~~~~~~~~~~~~~~~~~~~~~~~~~~~~~~~~~~~~~~~~~~~~~~
~~~~~~~~~~~~~~~~~~~~~~~~~~~~~~~~~~~~~~~~~~~~~~~~~~
🔹 Expected Move
The expected move is the predicted dollar change in the underlying stock's price by a given option's expiration date, with 68% certainty. It is calculated using the expiration's pricing and implied volatility levels.
Expected Move Calculation
Expected Move = (ATM straddle price x 0.6) + (1st OTM strangle price x 0.3) + (2nd OTM strangle price x 0.1)
For example , if stock XYZ is trading at 121 and the ATM straddle is 4.40, the 120/122 strangle is 3.46, and the 119/123 strangle is 2.66, the expected move is calculated as follows: 4.40 x 0.60 = 2.64; 3.46 x 0.30 = 1.04; 2.66 x 0.10 = 0.27; Expected move = 2.64 + 1.04 + 0.27 = ±3.9
🔹 Standard deviation
One standard deviation of a stock encompasses approximately 68.2% of outcomes in a distribution of occurrences based on current implied volatility.
We use the expected move formula to calculate the one standard deviation range of a stock. This calculation is based on the days-to-expiration (DTE) of our option contract, the stock price, and the implied volatility of a stock:
Calculation:
Standard Deviation = Closing Price * Implied Volatility * sqrt(Days to Expiration / 365)
According to options literature, there is a 68% probability that the underlying asset will fall within this one standard deviation range at expiration.
∑ Quant Observation: The values of the expected move and the 1st standard deviation (1STD) will not match because they use different calculation methods, even though both are referred to as representing 68% of the underlying asset's movement in options literature. The expected move is based on direct market pricing of ATM options. The 1STD, on the other hand, uses the averaged implied volatility (IVX) for the given expiration to determine its value. Based on our experience, it is better to consider the area between the expected move and the 1STD as the true representation of the original 68% rule.
~~~~~~~~~~~~~~~~~~~~~~~~~~~~~~~~~~~~~~~~~~~~~~~~~~
~~~~~~~~~~~~~~~~~~~~~~~~~~~~~~~~~~~~~~~~~~~~~~~~~~
🔶 USAGE
~~~~~~~~~~~~~~~~~~~~~~~~~~~~~~~~~~~~~~~~~~~~~~~~~~
~~~~~~~~~~~~~~~~~~~~~~~~~~~~~~~~~~~~~~~~~~~~~~~~~~
🔹 Create a new empty layout for the screener!
You can access this from the dropdown menu in the upper right corner. In the popup window, name it as you like, for example, "Option Screener."
🔹 Hide the candlestick chart
Make the chart invisible using the "Hide" option from the three-dot dropdown menu located in the upper left corner.
🔹 Other Unwanted Elements
If other unnecessary elements are distracting you (e.g., economic data, volume, default grid), you can easily remove them from the layout. Right-click on the empty chart area. Here, click on the gear (Settings) icon and remove everything from the "Events" tab, as well as from the "Trading" tab. Under the "Canvas" tab, it is recommended to set the "Grid lines" setting to "None."
~~~~~~~~~~~~~~~~~~~~~~~~~~~~~~~~~~~~~~~~~~~~~~~~~~
~~~~~~~~~~~~~~~~~~~~~~~~~~~~~~~~~~~~~~~~~~~~~~~~~~
🔶 Screener Settings
~~~~~~~~~~~~~~~~~~~~~~~~~~~~~~~~~~~~~~~~~~~~~~~~~~
~~~~~~~~~~~~~~~~~~~~~~~~~~~~~~~~~~~~~~~~~~~~~~~~~~
Naturally, the font size and position can be easily adjusted.
Additionally, there are two basic usage modes: manual input or using the preset list.
🔹If you selected “Manual Below” in the preset dropdown, the tickers you chose from the dropdown (up to a maximum of 40) will be displayed. The panel name will be the one you specified.
🔹If you selected a pre-assembled list , the manually entered list will be ignored, and the preset list will be displayed. (In the future, we will expand the preset list based on your feedback!).
~~~~~~~~~~~~~~~~~~~~~~~~~~~~~~~~~~~~~~~~~~~~~~~~~~
~~~~~~~~~~~~~~~~~~~~~~~~~~~~~~~~~~~~~~~~~~~~~~~~~~
🔶 Best Practices for TanukiTrade Option Screener:
~~~~~~~~~~~~~~~~~~~~~~~~~~~~~~~~~~~~~~~~~~~~~~~~~~
~~~~~~~~~~~~~~~~~~~~~~~~~~~~~~~~~~~~~~~~~~~~~~~~~~
🔹 Every Preset on a New Layout:
If you following the steps above, you easy can setup this screener in one window with one split layout:
🔹 Split Layout:
- Left Side: The underlying asset with our Options IV Overlay (IVR, Deltas, Expected Move, STD1, Skew visualized) along with the Enhanced Murrey Math Indicator and Option Expiry.
- Right Side: Searching for opportunities using our Options Screener.
Opportunities Search
🔹 Everything in One Layout + One Window:
This is the all-in-one view:
- The underlying asset with our Options IV Overlay (IVR, Deltas, Expected Move, STD1, Skew visualized)
- Enhanced Murrey Math Indicator and Option Expiry
- Options Screener on the left
~~~~~~~~~~~~~~~~~~~~~~~~~~~~~~~~~~~~~~~~
🔶 ADDITIONAL IMPORTANT COMMENTS
- U.S. market only:
Since we only deal with liquid option chains: this option indicator only works for the USA options market and do not include future contracts; we have implemented each selected symbol individually.
- Why is there a slight difference between the displayed data and my live brokerage data? There are two reasons for this, and one is beyond our control.
- Brokerage Calculation Differences:
Every brokerage has slight differences in how they calculate metrics like IV and IVx. If you open three windows for TOS, TastyTrade, and IBKR side by side, you will notice that the values are minimally different. We had to choose a standard, so we use the formulas and mathematical models described by TastyTrade when analyzing the options chain and drawing conclusions.
- Option-data update frequency:
According to TradingView's regulations and guidelines, we can update external data a maximum of 5 times per day. We strive to use these updates in the most optimal way:
(1st update) 15 minutes after U.S. market open
(2nd, 3rd, 4th updates) 1.5–3 hours during U.S. market open hours
(5th update) 10 minutes before market close.
You don’t need to refresh your window, our last refreshed data-pack is always automatically applied to your indicator , and you can see the time elapsed since the last update at the bottom of your indicator.
- Weekly illiquid expiries:
The Weekly Horizontal IVx Skew may not carry relevant information for instruments not included in the 'Weeklies & Volume Masters' preset package.
-Timeframe Issues:
Our option indicator visualizes relevant data on a daily resolution. If you see strange or incorrect data (e.g., when the options data was last updated), always switch to a daily (1D) timeframe. If you still see strange data, please contact us.
Disclaimer:
Our option indicator uses approximately 15min-3 hour delayed option market snapshot data to calculate the main option metrics. Exact realtime option contract prices are never displayed; only derived metrics and interpolated delta are shown to ensure accurate and consistent visualization. Due to the above, this indicator can only be used for decision support; exclusive decisions cannot be made based on this indicator . We reserve the right to make errors.This indicator is designed for options traders who understand what they are doing. It assumes that they are familiar with options and can make well-informed, independent decisions. We work with public data and are not a data provider; therefore, we do not bear any financial or other liability.

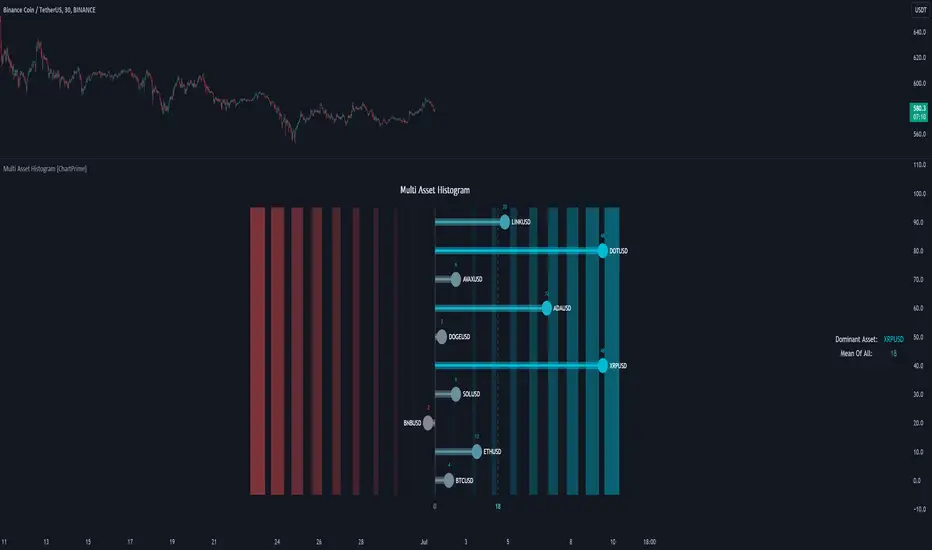
Multi Asset Histogram [ChartPrime]Multi Asset Histogram Indicator
Overview:
The "Multi Asset Histogram" indicator provides a comprehensive visualization of the performance of multiple assets relative to each other. By calculating a score for each asset and displaying it in a histogram format, this indicator helps traders quickly identify the trends, dominant asset and the average performance of the assets in the selected group.
Key Features:
◆ Multi-Asset Score Calculation:
The indicator calculates a trend score for each selected asset based on the price source (e.g., hl2).
The trend score is determined by comparing the current price to the prices over the past bars back defined by user, adding or subtracting points based on whether the current price is higher or lower than previous prices.
// Score Function
trscore(src) =>
total = 0.0
for i = 1 to 50
total += (src >= nz(src ) ? 1 : -1)
total
◆ Flexible Symbol Input:
Traders can input up to 10 different symbols (e.g., BTCUSD, ETHUSD, etc.) to be included in the histogram analysis.
◆ Dynamic Visualization:
A histogram is plotted for each asset, with bars colored based on the score, providing a clear visual representation of the relative performance.
Color gradients from red to aqua indicate the performance, with red representing negative scores and aqua representing positive scores.
◆ Adaptive Histogram Lines:
The width and placement of histogram lines adapt based on the calculated scores, ensuring clear visualization regardless of the values.
Dashed lines represent the mean score of all assets, helping traders identify the overall market trend.
◆Detailed Labels and Values:
Labels are placed on the histogram to display the exact score for each asset.
Mean value and zero line labels provide additional context for the overall performance.
◆ Visual Scaling Lines:
Zero line and mean line are clearly marked, helping traders understand the distribution and scale of scores.
Scales on the left and right of the histogram indicate the performance range.
◆ Informative Table:
A table is displayed on the chart, showing the dominant asset (the one with the highest score) and the mean score of all assets.
The table updates dynamically to reflect real-time changes in asset performance.
◆ Settings:
Length: The value of number bars back is greater or less than the current value of the source
Source: The price source to be used for score calculation (e.g., hl2).
Symbols: Up to 10 different asset symbols can be input for analysis.
Usage Notes:
This indicator is useful for traders who monitor multiple assets simultaneously and need a quick visual reference to identify the strongest and weakest performers.
The color coding and dynamic labels make it easy to interpret the relative performance and make informed trading decisions.
This indicator is designed to enhance multi-asset analysis by providing a clear, visual representation of each asset's performance relative to the others, making it easier to identify trends and dominant assets in the market.
Multiple Instrument Automation ScreenerI have developed a Pine Script indicator on TradingView designed to demonstrate how to automate execution for ten instruments. This example utilizes a straightforward, Simple Moving Average (SMA) indicator. You can use it as a template, but use your indicator.
The indicator computes long/short signals based on the crossing of the SMA using the security function
It acts as a screener, presenting calculation results in an organized table format.
Utilizing the varip variable, the indicator sends alerts for multiple instruments sequentially rather than simultaneously.
For every generated signal, the indicator builds and sends a JSON execution command to a third-party tool, ensuring seamless integration and automation. You can use your own format.
Sent alerts look like this:
{"ticker": "DOGEBTC","action": "buy","price": "0.00000199","time": "1719754620658"}
Details and Limitations
Instrument Limit: The example is configured for ten instruments for simplicity. However, it can be expanded to handle up to 40 instruments.
Alert Rate Limit: There is a rate limit of 15 alerts in 3 minutes. Exceeding this limit may cause some alerts to be stopped. This can be managed by tracking the alert times and delaying some alerts, though this may affect the entry prices.
Timing of Signal Generation : The indicator processes signals at the bar close to the active instrument. Due to its computational complexity, there is a slight delay in collecting all records, potentially causing signals to reflect a few seconds before the bar closes. Care should be taken when executing based on these signals.
Disclaimer
Please remember that past performance may not be indicative of future results.
Due to various factors, including changing market conditions, the strategy may no longer perform as well as in historical backtesting.
This post and the script don’t provide any financial advice.

Ultimate UT Bot ScreenerWhat Does the Ultimate UT Bot Screener Do?
Ultimate UT Bot Screener will help you navigate UT Bot signals and backtest results for up to 40 instruments simultaneously. It scans the market for provided UT Bot indicator parameters, calculates essential metrics, and displays the information in 1 fully customizable table.
How Does It Work?
Market Scanning : The screener scans multiple instruments for the selected timeframe, ensuring you never miss an opportunity.
Customizable Parameters : Adjust the UT Bot parameters to fit your unique trading style and risk tolerance.
Filtering and Sorting : Use advanced filtering and sorting options to narrow down the results based on your specific criteria.
Alerts and Notifications : Set up custom alerts to stay updated on important market movements and potential trades.
Visual Customization : Tailor the screener's visual appearance to suit your preferences, making data interpretation effortless.
Currently, Ultimate UT Bot Screener Supports 13 columns:
Price - the last price of the instrument
UT Signal - last UT bot signal. Value in the square brackets ( for ex.) means how many bars ago the last signal fired.
Move To Revert —We have to observe the price move for the current bar to see the UT Bot signal change.
Revert Prob - probability estimation for UT Bot to revert for the current bar.
Trade History - the last five trade outcomes are coded as green(profit)/red(loss) squares.
Total Trades - total trades number for UT Bot strategy for the entire available history.
Current P&L - P&L for the open trade
Trade Avg P&L - Average P&L for the last X trades
Trade Prof - percent profitable trades from the last X trades
Profit Factor - profit factor the last X trades
Net Profit - total net Profit for the last X trades
Max DD - maximum drawdown for the last X trades Avg Bars in Trades - average trade duration for the last X trades
How to Use the Ultimate UT Bot Screener
Using the Ultimate UT Bot Screener is straightforward:
Set Up Your Screener : Choose the instruments you want to monitor and configure the columns to display the data most relevant to you.
Customize Parameters : Fine-tune the UT Bot parameters to align with your trading strategy. Filter and Sort: Apply filters to isolate the most promising trading opportunities and sort the results based on your priorities.
Monitor and Act: Keep an eye on the screener and act on the high-probability signals it generates. Set up alerts to ensure you never miss a critical trade.
Why Is the Ultimate UT Bot Screener Original and Worth Paying For?
Highly Customizable : our tool allows you to configure almost every element, from the set of columns and instruments to the UT Bot parameters and visual appearance.
User-Friendly Interface : Designed with traders in mind, the screener offers an intuitive interface that makes complex data easy to understand and act upon.
Time-Saving : By automating the market scanning and analysis process, it saves you valuable time and effort, allowing you to focus on executing your trades.
Real-Time Alerts : Stay ahead of the market with customizable alerts that notify you of important events and potential trades.
Disclaimer : Please remember that past performance may not be indicative of future results. Due to various factors, including changing market conditions, the strategy may no longer perform as well as in historical backtesting. This post and the script don't provide any financial advice.

TanHef Ranks ScreenerTanHef Ranks Screener: A Numeric Compass to Market Tops and Bottoms
█ Simple Explanation:
The TanHef Ranks Screener illustrates the ‘TanHef Ranks’ indicator, designed to signal 'buy low and sell high' opportunities through numerical rankings. Larger numbers represent stronger signals, with negative numbers indicating potential ‘buy’ opportunities and positive numbers suggesting possible ‘sell’ moments.
█ TanHef Ranks Indicator:
View the TanHef Ranks Indicator description prior to using the screener.
█ Ticker Input Method:
Add tickers to the screener using a text area list in a CSV-styled (comma-separated values) list and/or through individual ticker inputs. The text area supports various delimiters, including commas, spaces, semicolons, apostrophes, and new lines. To ensure the expected exchange is used, the exchange prefix should be included when using a text area list.
█ Pair Configuration:
Quickly set up specific trading pairs by comparing tickers to the chart’s symbol or a specified input. This feature is useful for identifying opportunities in obscure trading pairs.
█ Total Combined Average Rank:
Compute the average rank of all tickers to highlighting overall market opportunities. When combined with the 'Pair Configuration' settings, it allows for identifying specific opportunities where one ticker may present a better trading opportunity relative to others.
█ Screener Display Settings:
Customize color-coded rank thresholds, text details, toggle visibility of numerical rankings, and other display settings. Hover over tickers for tooltips with full ticker names and rankings, ideal for small fonts or screens.
█ Alerts:
Set up alerts for individual ticker ranks or total average ranks. To avoid inconsistent or excessive alerts within a short period of time due to TradingView's alert frequency limits, it is recommended to use alerts set to occur at bar close to guarantee alerts. For immediate alerts, consider configuring them directly within the ‘TanHef Ranks’ indicator for better reliability. For the most up-to-date suggestions, hover the tooltips within the indicator’s alert settings.
█ Additional Clarity:
All the settings and functionality are described in detail within the tooltips beside each setting in the indicator’s settings. Hover over each tooltip for comprehensive explanations and guidance on how to configure and use the screener effectively.
█ How To Access:
Follow the Author's Instructions below to get access.

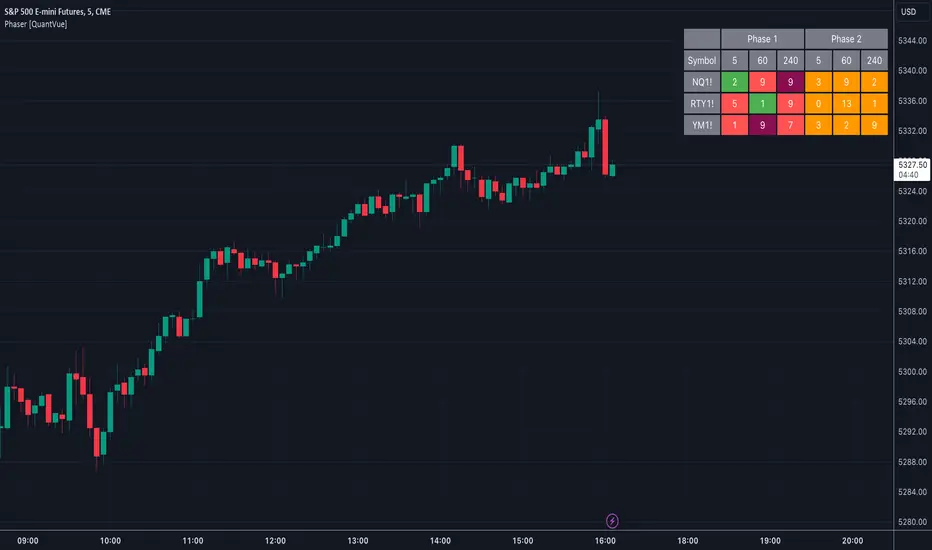
Phaser [QuantVue]The Phaser indicator is a tool to help identify inflection points by looking at price relative to past prices across multiple timeframes and assets.
Phase 1 looks for the price to be higher or lower than the closing price of the bar 4 bars earlier and is complete when 9 consecutive bars meet this criterion.
A completed Phase 1 is considered perfect when the highs (bearish) or lows (bullish) have been exceeded from bars 6 and 7 of the phase.
A bullish setup requires 9 consecutive closes less than the close 4 bars earlier.
A bearish setup requires 9 consecutive closes greater than the close 4 bars earlier.
Phase 2 begins once Phase 1 has been completed. Phase 2 compares the current price to the high or low of two bars earlier.
Unlike Phase 1, Phase 2 does not require the count to be consecutive.
Phase 2 is considered complete when 13 candles have met the criteria.
An important aspect to Phase 2 is the relationship between bar 13 and bar 8.
To ensure the end of Phase 2 is in line with the existing trend, the high or low of bar 13 is compared to the close of bar 8.
A bullish imperfect 13 occurs when the current price is less than the low of 2 bars earlier, but the current low is greater than the close of bar 8 in Phase 2.
A bearish imperfect 13 occurs when the current price is greater than the high of 2 bars earlier, but the current high is less than the close of bar 8 in Phase 2.
Phase 2 does not need to go until it is complete. A Phase 2 can be canceled if the price closes above or below the highest or lowest price from Phase 1.
Settings
3 Tickers
3 Timeframes
Show Phase 1
Show Phase 2
User-selected colors
RSI Screener / Heatmap - By LeviathanThis script allows you to quickly scan the market by displaying the RSI values of up to 280 tickers at once and visualizing them in an easy-to-understand format using labels with heatmap coloring.
📊 Source
The script can display the RSI from a custom timeframe (MTF) and custom length for the following data:
- Price
- OBV (On Balance Volume)
- Open Interest (for crypto tickers)
📋 Ticker Selection
This script uses a different approach for selecting tickers. Instead of inputting them one by one via input.symbol(), you can now copy-paste or edit a list of tickers in the text area window. This approach allows users to easily exchange ticker lists between each other and, for example, create multiple lists of tickers by sector, market cap, etc., and easily input them into the script. Full credit to @allanster for his functions for extracting tickers from the text. Users can switch between 7 groups of 40 tickers each, totaling 280 tickers.
🖥️ Display Types
- Screener with Labels: Each ticker has its own color-coded label located at its RSI value.
- Group Average RSI: A standard RSI plot that displays the average RSI of all tickers in the group.
- RSI Heatmap (coming soon): Color-coded rows displaying current and historical values of tickers.
- RSI Divergence Heatmap (coming soon): Color-coded rows displaying current and historical regular/hidden bullish/bearish divergences for tickers.
🎨 Appearance
Appearance is fully customizable via user inputs, allowing you to change heatmap/gradient colors, zone coloring, and more.

PAT Screener | Flux Charts💎 GENERAL OVERVIEW
Introducing our new Price Action Toolkit (PAT) Screener! This screener can spot trading opportunities that Price Action Toolkit offers across 8 different tickers! We believe that this screener will help you take a glimpse of the current state of the market much easier.
Features of the new Price Action Toolkit (PAT) Screener :
Finds Latest Across 8 Tickers:
Order Blocks
Breaker Blocks
Fair Value Gaps (FVG)
Inversion FVGs
Market Structures (BOS, CHoCH, CHoCH+)
Liquidity Zones
Liquidity Grabs
Premium / Discount Zones
Shows Additional Information Like :
Strength
Retests
(Bullish & Bearish) Volume
Consumption
Also :
All Features Support Tuning
Customizable Theme
📌 HOW DOES IT WORK ?
1. Order Blocks
Order blocks occur when there is a high amount of market orders exist on a price range. It is possible to find order blocks using specific formations on the chart.
The high & low volume of order blocks should be taken into consideration while determining their strengths. The determination of the high & low volume of order blocks are similar to FVGs, in a bullish order block, the high volume is the last 2 bars' total volume, while the low volume is the oldest bar's volume. In a bearish order block scenario, the low volume becomes the last 2 bars' total volume.
2. Breaker Blocks
Breaker blocks form when an order block fails, or "breaks". It is often associated with market going in the opposite direction of the broken order block, and they can be spotted by following order blocks and finding the point they get broken, i.e. price goes below a bullish order block.
The volume of a breaker block is simply the total volume of the bar that the original order block is broken. Often the higher the breaking bar's volume, the stronger the breaker block is.
The strength of Order & Breaker Blocks are calculated by the size of the block to the Average True Range (ATR) of the chart.
3. Fair Value Gaps
Fair value gaps often occur when there is an imbalance in the market, and can be spotted with a specific formation on the chart.
The volume when the FVG occurs plays an important role when determining the strength of it, so we've placed two bars on the FVG zone, indicating the high & low volumes of the FVG. The high volume is the total volume of the last two bars on a bullish FVG, while the low volume is - of the FVG. For a bearish FVG, the total volume of the last two bars is the low volume. The indicator can also detect FVGs that exist in other timeframes than the current chart.
4. Inversion Fair Value Gaps
A Fair Value Gap generally occur when there is an imbalance in the market. They can be detected by specific formations within the chart. An Inverse Fair Value Gap is when a FVG becomes invalidated, thus reversing the direction of the FVG.
IFVGs get consumed when a Close / Wick enters the IFVG zone. Check this example:
5. Market Structures
Sometimes specific market structures form and break as the market fills buy & sell orders. Formed Change of Character (CHoCH) and Break of Structure (BOS) often mean that market will change direction, and they can be spotted by inspecting low & high pivot points of the chart.
The number of times the chart recently had a BOS is displayed between brackets, Ex : (3)
6. Liquidity Zones
Buyside & Sellside Liquidity zones are where most traders place their take-profits and stop-losses in their long / short positions. They are spotted by using high & low pivot points on the chart.
7. Liquidity Grabs
Liquidity grabs occur when one of the latest pivots has a false breakout. Then, if the wick to body ratio of the bar is higher than 0.5 (can be changed from the settings) a liquidity grab has occurred.
8. Premium & Discount Zones
The premium zone is a zone that is over the fair value of the asset's price, and the discount zone is the opposite. They are formed by the latest high & low pivot points.
If the latest close price is outside the Premium or Discount zone, you will see "Premium ⬆️" or "Discount ⬇️". These mean that the price is currently higher than the premium zone or lower than the discount zone.
🚩UNIQUENESS
This screener offers a comprehensive dashboard for traders, combining multiple analytical elements with customizable settings to aid in decision-making across different tickers and timeframes. We believe that this will help traders spot trading opportunities much easier by providing crucial information in a single dashboard. Our new screener contains of common elements like Order & Breaker Blocks, Fair Value Gaps & IFVGs as well as rather unique elements like Liquidity Grabs . With the use of up to 8 tickers & timeframes , you can easily take a look at the bigger picture of the market. We recommend reading the "How Does It Work" section of the description to get a better understanding about how this indicator is unique to others.
⚙️SETTINGS
1. Tickers
You can set up to 8 tickers for the screener to scan here. You can also enable / disable them and set their individual timeframes.
You can enable / disable Retests, Strength, Consumption and (Bullish & Bearish) Volume for :
Order Blocks (Retests, Strength, Bullish & Bearish Volume)
Breaker Blocks (Retests, Strength, Volume)
Fair Value Gaps (Retests, Consumption, Strength, Bullish & Bearish Volume)
Inversion Fair Value Gaps (Retests, Consumption, Strength, Volume)
2. Order Blocks
Enabled -> Enables / Disables Order Blocks
Zone Invalidation -> Select between Wick & Close price for Order Block Invalidation.
Swing Length -> Swing length is used when finding order block formations. Smaller values will result in finding smaller order blocks.
3. Breaker Blocks
Enabled -> Enables / Disables Breaker Blocks
Zone Invalidation -> Select between Wick & Close price for Breaker Block Invalidation.
4. Fair Value Gaps
Enabled -> Enables / Disables Fair Value Gaps
Zone Invalidation -> Select between Wick & Close price for FVG Zone Invalidation.
Zone Filtering -> With "Average Range" selected, algorithm will find FVG zones in comparison with average range of last bars in the chart. With the "Volume Threshold" option, you may select a Volume Threshold % to spot FVGs with a larger total volume than average.
FVG Detection -> With the "Same Type" option, all 3 bars that formed the FVG should be the same type. (Bullish / Bearish). If the "All" option is selected, bar types may vary between Bullish / Bearish.
Detection Sensitivity -> You may select between Low, Normal or High FVG detection sensitivity. This will essentially determine the size of the spotted FVGs, with lower sensitivities resulting in spotting bigger FVGs, and higher sensitivities resulting in spotting all sizes of FVGs.
5. Inversion Fair Value Gaps
Zone Invalidation -> Select between Wick & Close price for IFVG Zone Invalidation. This setting also switches the type for IFVG consumption.
6. Market Structures
Break Of Structure (BOS) -> If the current structure of the market is broken in a bullish or bearish direction, it will be displayed.
Change Of Character (CHoCH) -> If the market shifts into another direction, it will be displayed.
Change Of Character+ (CHoCH+) -> This will display Change Of Characters detected with higher sensitivity if enabled.
7. Liquidity Zones
Buyside Liquidity -> Enables / Disables Buyside Liquidity
Sellside Liquidity -> Enables / Disables Sellside Liquidity
8. Liquidity Grabs
Pivot Length -> This setting determines the range of the pivots. This means a candle has to have the highest / lowest wick of the previous X bars and the next X bars to become a high / low pivot.
Wick-Body Ratio -> After a pivot has a false breakout, the wick-body ratio of the latest candle is tested. The resulting ratio must be higher than this setting for it to be considered as a liquidity grab.
9. Premium & Discount Zones
Enabled -> Enables / Disables Premium & Discount Zones.
10. Style
You can customize the visual looks of the screener here.
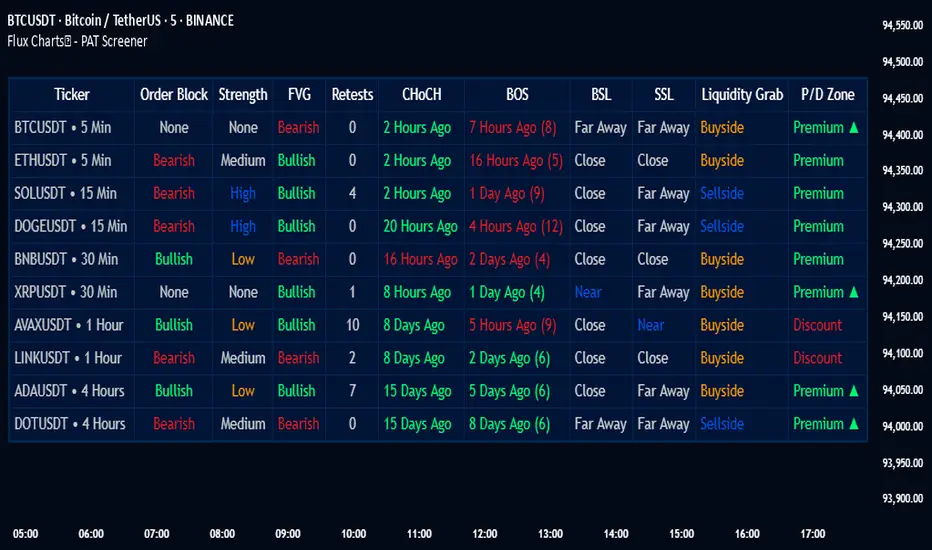
Trade-o-Scope: Multi-Asset Price TrackerTrade-o-Scope team presents the "Multi-Asset Price Tracker" indicator.
"Multi-Asset Price Tracker" is designed to help analyze price changes across multiple assets within time intervals you define.
Motivation:
Most screeners on the market track price changes over predefined periods, like 1H\4H\12H\1D\3D\7D\etc. Typically, they compare initial and current prices.
But what if you want to analyze assets' performance over arbitrary historical intervals?
Perhaps you want to spot which assets dropped most within 7 hours after a specific industry announcement? Or do you want to check which asset grew the most in January last year?
This is where the "Multi-Asset Price Tracker" shines. It lets you define arbitrary intervals and track price changes for selected assets.
Overview and functionality:
Define arbitrary time intervals in history for analyzing price changes.
Create up to 10 lists, each with up to 40 symbols to track. Populate lists with data from text files, Excel, or CSV. Lists are just multiline text strings, each line representing an individual symbol.
Switch between lists, with one active list at a time.
Specify up to 3 fixed symbols for additional analysis alongside active list symbols. You may use them as reference points to compare price changes of the symbols in the List.
Customize table appearance and position.
Set sorting criteria and direction for displayed values.
View the results in a table on the chart.
How it works:
"Multi-Asset Price Tracker" will track the symbol's price during the interval you define.
The indicator identifies each symbol's Start, Max, Min, and End prices during the interval. It then calculates relative changes: Start-to-Max, Start-to-Min, and Start-to-End.
The list of relative changes is ordered by the column chosen in settings and displayed on the chart.
List example (up to 10 Lists):
BINANCE:WLDUSDT.P
BINANCE:WOOUSDT.P
BINANCE:XEMUSDT.P
...
...
(up to 40 symbols per List)
Calculation example:
Symbol Start-price = $100
Symbol Max-price = $150
Symbol Min-price = $75
Symbol End-price = $110
Start-to-Max = 100% * (Max-price - Start-price) / Start-price = 100% * ($150 - $100) / $100 = 50%
Start-to-Min = 100% * (Min-price - Start-price) / Start-price = 100% * ($75 - $100) / $100 = -25%
Start-to-End = 100% * (End-price - Start-price) / Start-price = 100% * ($110 - $100) / $100 = 10%
Chart example:
In the provided chart, you can observe an example with a table generated by the indicator, along with manually added arrows and labels explaining the calculation process for an individual symbol from the list.
How to use:
1) Add "Multi-Asset Price Tracker" indicator to the chart
2) The indicator will ask you to define the start and the end of the interval using the mouse on the chart.
Voila! You'll see the table with sorted relative price changes based on default list values and settings.
3) Customize the indicator's settings:
Define the interval Start and End datetime.
Optionally, change the interval Start and End by clicking on the indicator name and dragging the vertical mark at the edges of the interval to a new position.
Define the Start and End price sources.
Choose a color to highlight the interval on the chart's background.
Set the table position, size, text size, and border size.
Specify the column for sorting and its direction.
Choose whether to sort chart symbols and fixed symbols together with list symbols or display them at the top of the table irrespective of their relative price change.
Enable fixed symbols if needed, and define up to 3 fixed symbols.
Define symbol lists, with up to 10 lists and 40 symbols each.
Select which List to make active - symbols from the active list will be calculated and displayed.
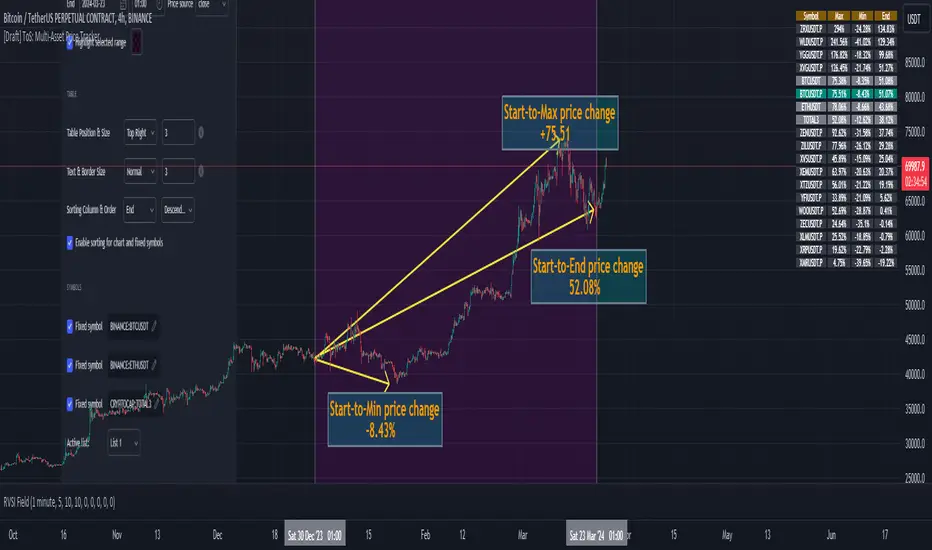
Market Structures Screener | Flux Charts💎 GENERAL OVERVIEW
Introducing our new Market Structures Screener! This screener can provide information about the latest market structures in up to 5 tickers. You can also customize the styling of the screener.
Features of the new Market Structures Screener :
Find Latest Market Structures Across 5 Tickers
Break Of Structure (BOS)
Change of Character (CHoCH)
Change of Character+ (CHoCH+)
Customizable Algoritm / Styling
📌 HOW DOES IT WORK ?
Sometimes specific market structures form and break as the market fills buy & sell orders. Formed Change of Character (CHoCH) and Break of Structure (BOS) often mean that market will change direction, and they can be spotted by inspecting low & high pivot points of the chart.
This screener then finds market structures across 5 different tickers, and shows the latest information about them.
🚩UNIQUENESS
Formed market structures can be strong hints about the current direction and the state of the market, and our screener has the ability to detect Change Of Character structures of the market with higher sensitivity (CHoCH+), so you will miss less hints. This screener will then show the elapsed time of the found BOS, CHoCH and CHoCH+ structures.
⚙️SETTINGS
1. Tickers
You can set up to 5 tickers for the screener to scan market structures here. You can also enable / disable them and set their individual timeframes.

Liquidity Grab Screener | Flux Charts💎 GENERAL OVERVIEW
Introducing our new Liquidity Grab Screener! This screener can provide information about the latest liquidity grabs in up to 5 tickers. You can also customize the algorithm that finds the liquidity grabs and the styling of the screener.
Features of the new Liquidity Grab Screener :
Find Latest Liquidity Grabs Accross 5 Tickers
Price, Size, Status Information
Customizable Algoritm / Styling
📌 HOW DOES IT WORK ?
Liquidity grabs occur when one of the latest pivots has a false breakout. Then, if the wick to body ratio of the bar is higher than 0.5 (can be changed from the settings) a bubble is plotted.
The bubble size is determined by the wick to body ratio of the candle.
This screener then finds liquidity grabs accross 5 different tickers, and shows the latest information about them.
Price -> The price when the liquidity grab happened.
Size -> Size of the liquidity grab, determined by the wick-body ratio.
Status -> Shows the elapsed time of the liquidity grab.
🚩UNIQUENESS
Liquidity grabs can be useful when determining candles that have executed a lot of market orders, and planning your trades accordingly. This screener will find liquidity grabs from up to 5 tickers and give information about their price, size and status. The screener also lets you customize the pivot length and the wick-body ratio for liquidity grabs.
⚙️SETTINGS
1. Tickers
You can set up to 5 tickers for the screener to scan order blocks here. You can also enable / disable them and set their individual timeframes.
2. General Configuration
Pivot Length -> This setting determines the range of the pivots. This means a candle has to have the highest / lowest wick of the previous X bars and the next X bars to become a high / low pivot.
Wick-Body Ratio -> After a pivot has a false breakout, the wick-body ratio of the latest candle is tested. The resulting ratio must be higher than this setting for it to be considered as a liquidity grab.

Fair Value Gap Screener | Flux Charts💎 GENERAL OVERVIEW
Introducing our new Fair Value Gap Screener! This screener can provide information about the latest Fair Value Gaps in up to 5 tickers. You can also customize the algorithm that finds the Fair Value Gaps and the styling of the screener.
Features of the new Fair Value Gap (FVG) Screener :
Find Latest Fair Value Gaps Accross 5 Tickers
Shows Their Information Of :
Latest Status
Number Of Retests
Consumption Percent
Bullish & Bearish Volume
Customizable Algoritm / Styling
📌 HOW DOES IT WORK ?
A Fair Value Gap generally occur when there is an imbalance in the market. They can be detected by specific formations within the chart. This screener then finds Fair Value Gaps accross 5 different tickers, and shows the latest information about them.
Status ->
Far -> The current price is far away from the FVG.
Approaching ⬆️/⬇️ -> The current price is approaching the FVG, and the direction it's approaching from.
Inside -> The price is currently inside the FVG.
Retests -> Retest means the price tried to invalidate the FVG, but failed to do so. Here you can see how many times the price retested the FVG.
Consumed -> FVGs get consumed when a Close / Wick enters the FVG zone. For example, if the price hits the middle of the FVG zone, the zone is considered 50% consumed.
Bullish / Bearish Volume -> Bullish & Bearish volume of a FVG is calculated by analyzing the bars that formed it. For example in a bullish FVG, the bullish volume is the total volume of the first 2 bars forming the FVG, and the bearish volume is the volume of the 3rd bar that forms it.
🚩UNIQUENESS
This screener can detect latest Fair Value Gaps and give information about them for up to 5 tickers. This saves the user time by showing them all in a dashboard at the same time. The screener also uniquely shows information about the number of retests and the consumed percent of the FVG, as well as it's bullish & bearish volume. We believe that this extra information will help you spot reliable FVGs easier.
⚙️SETTINGS
1. Tickers
You can set up to 5 tickers for the screener to scan Fair Value Gaps here. You can also enable / disable them and set their individual timeframes.
2. General Configuration
Zone Invalidation -> Select between Wick & Close price for FVG Zone Invalidation.
Zone Filtering -> With "Average Range" selected, algorithm will find FVG zones in comparison with average range of last bars in the chart. With the "Volume Threshold" option, you may select a Volume Threshold % to spot FVGs with a larger total volume than average.
FVG Detection -> With the "Same Type" option, all 3 bars that formed the FVG should be the same type. (Bullish / Bearish). If the "All" option is selected, bar types may vary between Bullish / Bearish.
Detection Sensitivity -> You may select between Low, Normal or High FVG detection sensitivity. This will essentially determine the size of the spotted FVGs, with lower sensitivies resulting in spotting bigger FVGs, and higher sensitivies resulting in spotting all sizes of FVGs.

Order Blocks Screener | Flux Charts💎 GENERAL OVERVIEW
Introducing our new Order Blocks Screener! This screener can provide information about the latest order blocks in up to 5 tickers. You can also customize the algorithm that finds the order blocks and the styling of the screener.
Features of the new Order Blocks Screener :
Find Latest Order Blocks Accross 5 Tickers
Latest Status, Restests, Bullish & Bearish Volume
Customizable Algoritm / Styling
📌 HOW DOES IT WORK ?
Order blocks occur when there is a high amount of market orders exist on a price range. It is possible to find order blocks using specific formations on the chart.
The high & low volume of order blocks should be taken into consideration while determining their strengths. The determination of the high & low volume of order blocks are similar to FVGs, in a bullish order block, the high volume is the last 2 bars' total volume, while the low volume is the oldest bar's volume. In a bearish order block scenerio, the low volume becomes the last 2 bars' total volume.
This screener then finds order blocks accross 5 different tickers, and shows the latest information about them.
Status ->
Far -> The current price is far away from the order block.
Approaching ⬆️/⬇️ -> The current price is approaching the order block, and the direction it's approaching from.
Inside -> The price is currently inside the order block.
Retests -> Retest means the price to invalidate the order block, but failed to do so. Here you can see how many times the price retested the order block.
For the bullish / bearish volume, check the "How Does It Work" section.
🚩UNIQUENESS
This screener can detect latest order blocks and give information about them for up to 5 tickers. This saves the user time by showing them all in a dashboard at the same time. The screener shows the number of the retests of the order block as an unique trait. Another unique ability of the screener is that it shows the latest valid order block's bullish and bearish volume in the dashboard.
⚙️SETTINGS
1. Tickers
You can set up to 5 tickers for the screener to scan order blocks here. You can also enable / disable them and set their individual timeframes.
2. General Configuration
Zone Invalidation -> Select between Wick & Close price for Order Block Invalidation.
Swing Length -> Swing length is used when finding order block formations. Smaller values will result in finding smaller order blocks.

RSI over screener (any tickers)█ OVERVIEW
This screener allow you to watch up to 240 any tickers you need to check RSI overbought and oversold using multiple periods, including the percentage of RSIs of different periods being overbought/oversold, as well as the average between these multiple RSIs.
█ THANKS
LuxAlgo for his RSI over multi length
I made function for this RSI and screener based on it.
allanster for his amazing idea how to split multiple symbols at once using a CSV list of ticker IDs
█ HOW TO USE
- hide chart:
- add 6 copies of screener
- change list number at settings from 1 to 6
- add you tickers
Screener shows signals when RSI was overbought or oversold and become to 0, this signal you may use to enter position(check other market condition before enter).
At settings you cam change Prefics, Appendix and put you tickers.
limitations are:
- max 40 tickers for one list
- max 4096 characters for one list
- tickers list should be separated by comma and may contains one space after the comma
By default it shows almost all BINANCE USD-M USDT tickers
Also you can adjust table for your screen by changing width of columns at settings.
If you have any questions or suggestions write comment or message.
