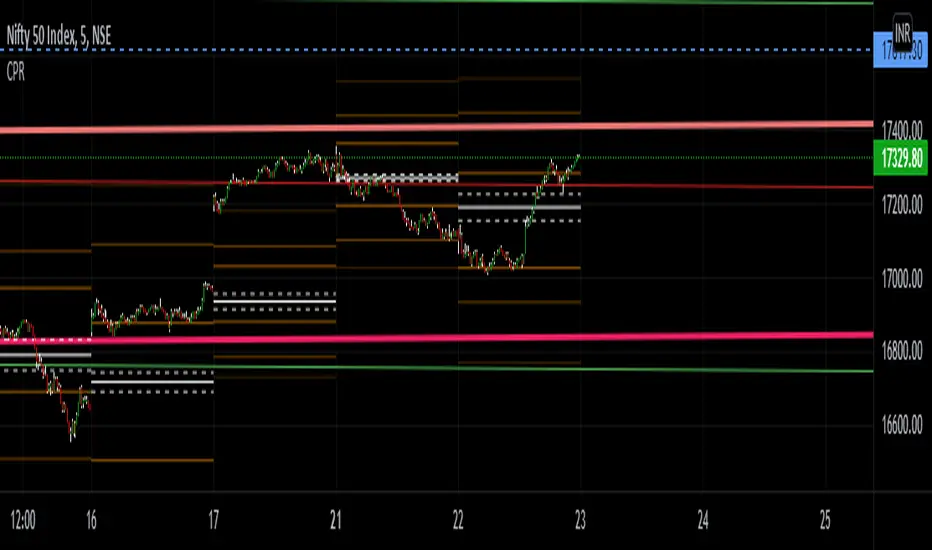
Future Pivots CPR - All Timeframes
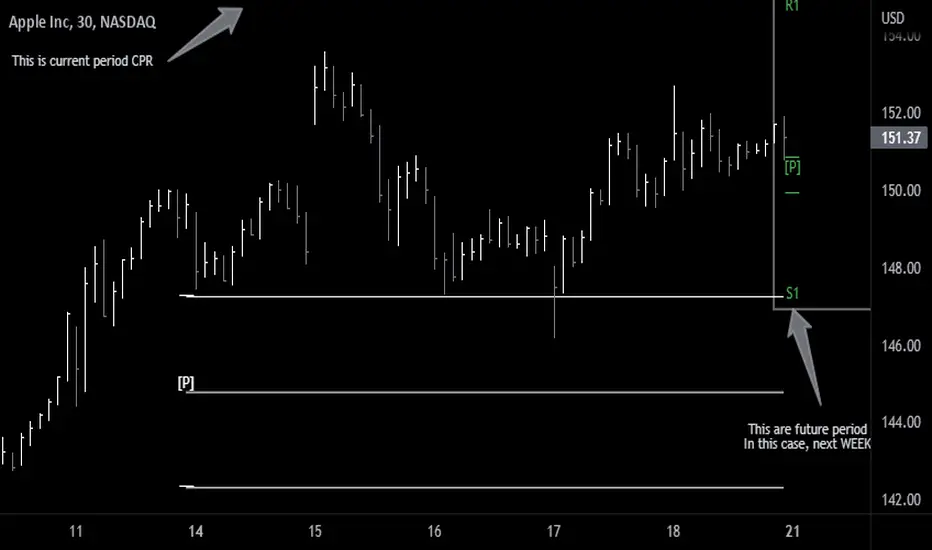
Simple idea that allows you to display tomorrow CPR/ Standard Floor Trader Pivots based on the high, low and close of today session. Likewise, it works for higher timeframes taking into account the high, low, close of the period (e.g. weekly, monthly, year).
Just be aware that -regardless of the timeframe- if the period is still in development, the indicator will constantly/ live update the values until the period is closed!! This indicator is meant to be used when preparing for the next trading period. If you want to use it live, I'd suggest using the function of this indicator which allows to display only current/closed pivots-
Similar to other script I published, this indicator lower timeframes (Daily and Weekly) will work with lower timeframe bars, this is the Minutes and Hour bars. Conversely, higher timeframe CPR/Pivots will work better with timeframes/charts from Daily and above.
Available tick/untick functions:
- Select timeframe
- Show current CPR & Support/Resistance
- Show tomorrow CPR & Support/Resistance
- Display historical CPR (CPR only)
- Show extended support and resistance lines (S2,S3,R2,R3) for current and future pivots.
Recherche dans les scripts pour "cpr"
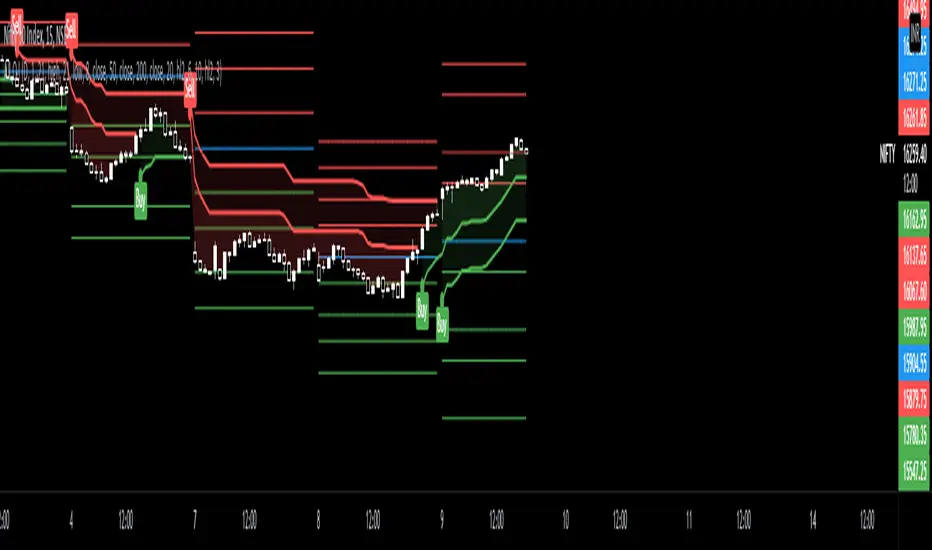
Central Pivot Ranges (CPR) & 3 x VWAP & BarcolorsThis Script Combines daily, weekly and monthly VWAP (Volume Weighted Average Price) with a intraday, daily, weekly and monthly CPR (Central Pivot Range) - which is considered by some traders as the bread and butter of the market for a reason. A combination of Multiple CPRs and VWAPs from different timeframes can provide you with interesting confluences that can give you more confidence in performing your trades.
CPR Features:
- The option to look at current or developing CPRs.
- A resolution selector for all 4 CPRs
- Options to hide and show Tops, Bottoms and Pivots separately
- Various Styling options
- Alerts
VWAP Features:
- 3 x preset VWAPs set to daily, weekly and monthly
- VWAP Lines from the daily O&C or H&L
- Previous VWAP for S/R
- Line Styling options
General Features:
- Barcolors by pivots crossed or daily, weekly and monthly VWAP.
- Barcolors by daily VWAP additionally contain an O and C check instead of just taking the price above or below the VWAP into consideration.

Intraday Multi timeframe CPRDue to the request of some users and inspired by "Intraday CPR " I updated "CPR for Intraday Trading " and added extra functionality for your convenience.
Intraday CPR levels are changed according to timeframe instead of previous day high, low and close
This indicator you can change timeframe : Week ,Day, 240 min ,180in, 120 min, 60 min
code credit : ThePivotTrader

Amit Advance CPRthis indicator shows the CPR along with the pivots for the next day and in the live market. It would be easy to see the favorite stocks CPR in advance.

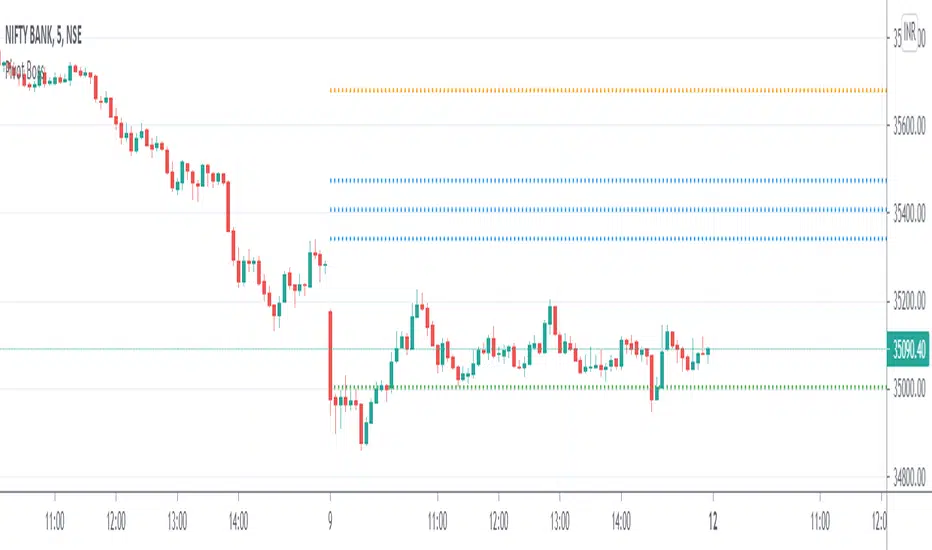
Pivot Boss - CPRThe Central Pivot Range (CPR) is used to identify key price points to set up trades. CPR is beneficial for intraday trading. This indicator can plot:
1. Daily Pivots and Daily Support/Resistance
2. Tomorrow Pivots and Support/Resistance
3. Weekly Pivots and Weekly Support/Resistance
4. Monthly Pivots and Monthly Support/Resistance
5. Previous Day High/Low
6. Previous Week and Month High/Low
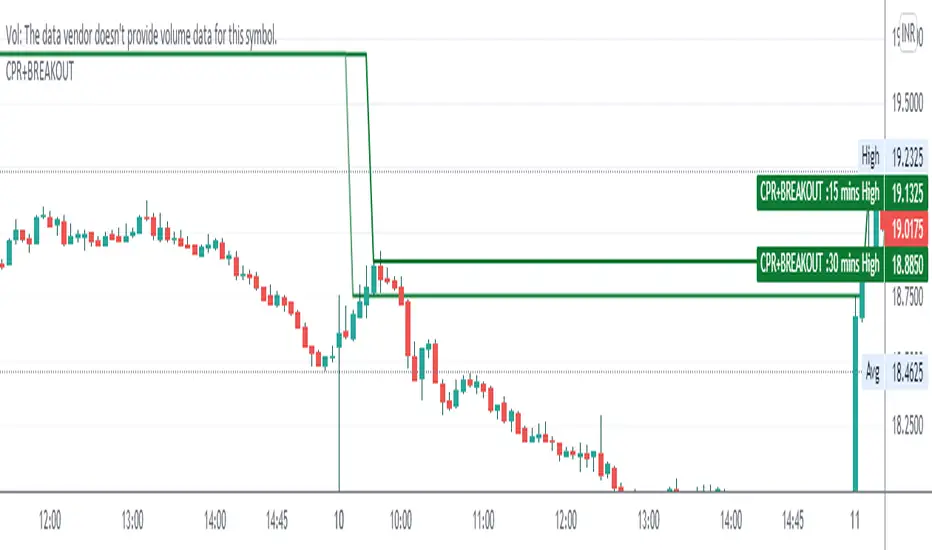
CPR WITH BREAKOUTCPR with 10-30 mins Breakout
This indicator includes CPR with 15-30 mins breakout, resistance, support, previous day low, previous day high, day low and day high etc,
please backtest before use
regards
The Malayali Trader
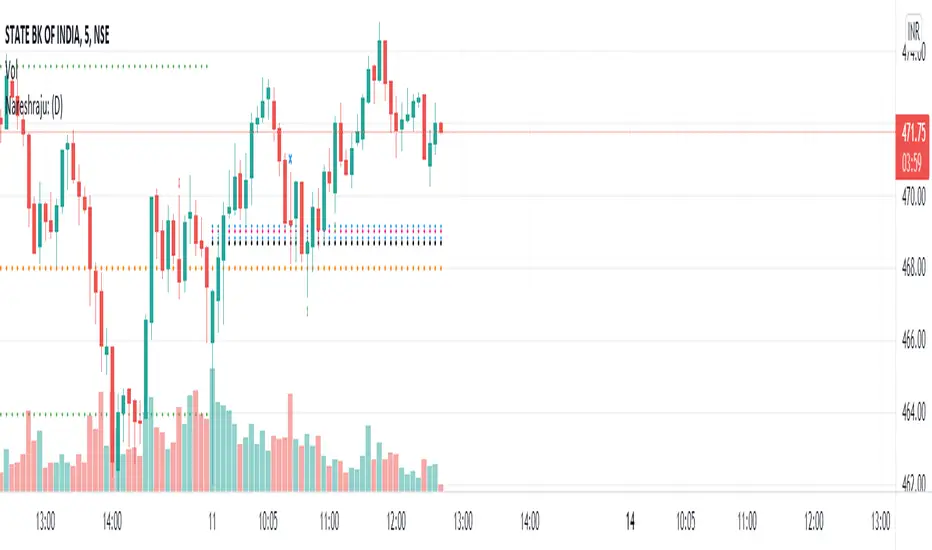
Nareshraju CPRHi friends this is Cpr indicator which means central pivot range. it contains supports and resistances to take perfect entry.
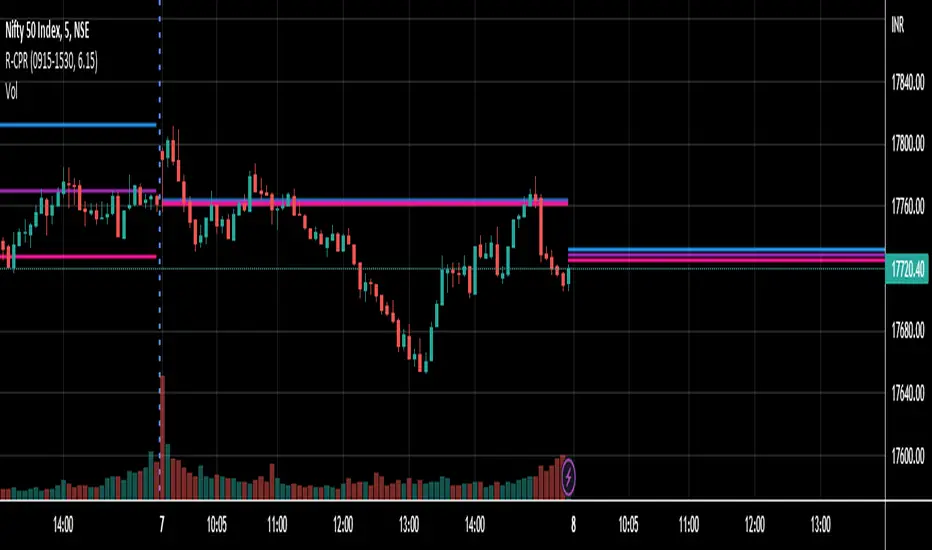
R-CPRThis is a simple CPR script that plots the following data,
Central Pivot,
Pivot,
Bottom Central Pivot.
Thanks.
Daily CPRThis script will plot the CPR and support/resistance lines on your chart for smaller time frame so that you use them for Intraday trading. This script also plots the previous day's high (PDH) and the previous day's low (PDL).
CPR with High of the daycpr calculation with high of the day can be used for trend reversals and bottom of the day

CPR BREAKOUT STRATEGY by ganeshCPR BUY STRATEGY:
This is buy only strategy for stocks for breakout play
Rules :
buy above yellow line with sl of red line tgt green line
with previous day high los close ploted

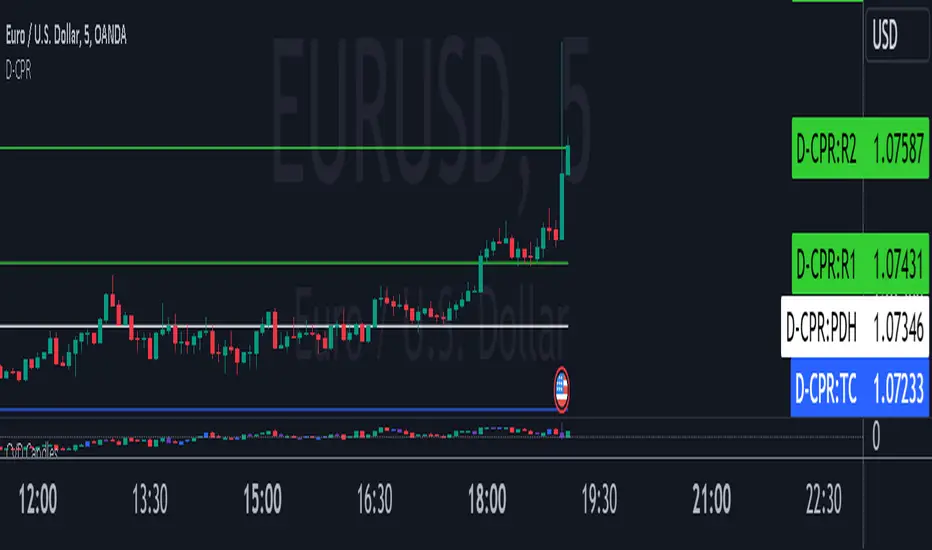
CPR by MTThe CPR indicator, or Central Pivot Range indicator, is a technical analysis tool used in trading to identify potential support and resistance levels based on the price action of a security. Developed by pivot point theory, it is particularly popular among day traders and swing traders. The CPR indicator consists of three lines:
1. **Pivot Point (PP):** This is the central line and is calculated as the average of the high, low, and closing prices from the previous trading period.
\
2. **Top Central Pivot (TC):** This is calculated by subtracting the low from the PP and then adding the result to the PP.
\
3. **Bottom Central Pivot (BC):** This is calculated by subtracting the high from the PP and then adding the result to the PP.
\
### How to Use the CPR Indicator
- **Trend Identification:** A wide CPR range indicates low volatility and a potential sideways or consolidation phase. A narrow CPR range indicates high volatility and a potential strong trending move.
- **Support and Resistance:** The top and bottom central pivots act as immediate resistance and support levels. If the price is above the TC, it indicates a bullish sentiment, while if it is below the BC, it indicates a bearish sentiment.
- **Entry and Exit Points:** Traders use the CPR lines to determine optimal entry and exit points. For example, if the price breaks above the TC and sustains, it may signal a buy opportunity, whereas a drop below the BC may signal a sell opportunity.
### Practical Example
Suppose a stock had a high of $105, a low of $95, and a closing price of $100 on the previous day. The CPR levels for the next day would be calculated as follows:
1. **Pivot Point (PP):**
\
2. **Top Central Pivot (TC):**
\
3. **Bottom Central Pivot (BC):**
\
The levels for the next day would be PP = $100, TC = $110, and BC = $90. Traders would then use these levels to assess potential trading strategies based on where the price moves relative to these levels.
### Conclusion
The CPR indicator is a useful tool for traders looking to understand market conditions and make informed decisions about entry and exit points. Its effectiveness comes from its ability to highlight key price levels derived from historical price data, helping traders predict potential market movements.

CPR Weekly Variable Weekday SellerGood afternoon traders,
This is a script I built for option selling, in attempt to have a high success rate. This is pretty much the same as my other one titled "CPR Option Selling Strategy." The difference is this one is strictly for Weeklies, with a variable weekday to expiry. I've had many requests to have a weekly that would end on Thursday, so here it is. Just select the date for expiry of the option, then it will calculate a "weekly" option set, using the the same set up as the traditional M-F weekly CPR information, except for offset for the weekday in question.
So for expiry dates for options on Thursday, you would choose "Thursday" in the parameters and it will calculate using Fri through Thu data for the pivot timeframes.
The rest is like this...
The gist of how it works:
It uses the opening or close of the current chart's timeframe opening bar when referenced against a "weekly" timeframe determined by the week ending weekday chosen for the central pivot range ( CPR ).
Using that comparison, this script calculates an option to sell: put, call, or iron condor. It will calculate a call value using an average of the CPR central pivot and the max value of the prior higher timeframe's high or R1 (whichever is higher.)
It does the same for the put side, but uses the higher timeframe's low or S1 (whichever is lower.)
It will use the option on the other side of the source (open or close) of the CPR as the "option in play."
Settings:
There are many settings, most are simply "viewable" settings, and probably self explanatory, others, not so much:
"Source for Trigger" - this is the value used on the "opening bar," such as the close. This value is the one compared to the Central Pivot Range in determining whether to sell a call (if the source is lower,) sell a put (if the source is higher,) or an iron condor if it's in the CPR .
"Show Historical Win/Loss Percentages" - this shows a table in the bottom right of the W/L percentages for the current ticker and settings. Used for a quick glance at historical success rates.
Example use (OLD EXAMPLE):
An example use (which I completed last week) on the chart referenced in this share: I sold a put-spread for $0.90, selling a 590 and buying a 570 strike in the middle of the week. I was looking at an hourly timeframe chart with a weekly pivot timeframe for the strategy.
Obviously, making only $0.90 on a $20 spread, there is a lot more to lose than to make, but I did some other analysis to go with it, so I felt safe, and I had a stop set for $1.50. So it worked, along with 3 other plays I did, very similar, and if that "Historical Win/Loss Percentage" is accurate, which I am fairly certain it is, I felt good about it.
The key all comes down to what you sell it for, right? That piece only you can determine. :)
Happy trading and enjoy,
Deuce

CPR by JBISIncludes CPR, Pivot Points and an EMA. This advanced technical indicator amalgamates critical components essential for robust market analysis: CPR (Central Pivot Range), Pivot Points, and EMA (Exponential Moving Average). Designed to empower traders with comprehensive insights, this indicator serves as a dynamic tool for chart analysis across various timeframes and markets.
CPR (Central Pivot Range):
Central Pivot Range, often abbreviated as CPR, represents a pivotal zone delineating critical support and resistance levels within a given trading session. Calculated from the previous session's high, low, and close, CPR helps identify potential reversal points and areas of price consolidation.
Pivot Points:
Pivot Points are key price levels derived from the previous session's high, low, and close. These levels serve as significant reference points for traders to anticipate potential price movements, gauge market sentiment, and formulate strategic entry and exit points.
EMA (Exponential Moving Average):
EMA, or Exponential Moving Average, is a widely-used trend-following indicator that places greater emphasis on recent price data. By smoothing out price fluctuations, EMA provides traders with a clearer depiction of market trends, facilitating timely decision-making and trend identification.
Key Features:
Customizable Parameters: Tailor the indicator settings to align with your trading strategy and risk tolerance.
Multi-Timeframe Analysis: Seamlessly analyze price action across different timeframes, enabling comprehensive market assessment and strategy formulation.
Visual Clarity: Intuitive chart visualization ensures easy interpretation of key levels and trend dynamics.
Real-Time Updates: Stay informed with real-time updates as market conditions evolve, empowering proactive decision-making and trade execution.

CPR LinesThe "CPR Lines" script, written in Pine Script version 5, is designed for use in the TradingView platform to help traders visualize Central Pivot Range (CPR) levels on their price charts. This script calculates and plots three essential pivot levels based on the prior trading day's high, low, and close prices, providing traders with key reference points for potential support and resistance levels in the current trading session.
Key Features:
Prior Day's Data Calculation:
The script retrieves the high, low, and close prices of the previous trading day using the request.security function. These values are crucial for calculating the CPR levels.
Central Pivot Line (CPL):
The CPL is calculated as the average of the prior day's high, low, and close prices. It serves as the primary pivot point around which the price action is likely to revolve.
Bottom Central Pivot (BCP):
The BCP is calculated as the average of the prior day's high and low prices. This level often acts as a support line in a bullish trend.
Top Central Pivot (TCP):
The TCP is derived by adding the difference between CPL and BCP to the CPL itself. This level can serve as a resistance line in a bearish trend.
Plotting the CPR Levels:
The script plots the CPL, BCP, and TCP on the chart with distinct black lines for easy identification. Each line is labeled accordingly and plotted with a linewidth of 2 for better visibility.
This script aids traders by providing visual cues for key price levels, enhancing their ability to make informed trading decisions based on historical price movements. By incorporating these pivot points, traders can better predict potential price reactions and plan their trades accordingly.

CPR with inside candle, Pivot Points and 4EMA The CPR trading strategy is a technical analysis approach that combines multiple indicators to determine potential price levels and trading opportunities. The strategy uses three main components: Inside Candles, Pivot Points, and the 4EMA.
Inside Candles: The Inside Candle pattern is a candlestick pattern where the current candle has a lower high and a higher low than the previous candle. This pattern can indicate a period of consolidation or indecision in the market and can signal a potential reversal or continuation of the trend.
Pivot Points: Pivot Points are technical indicators that use the previous day's price data to calculate key levels of support and resistance for the current trading day. These levels can act as potential areas of buying or selling pressure and can help traders identify potential entry and exit points.
4EMA: The 4EMA is a short-term Exponential Moving Average that tracks the average price of an asset over the previous four periods. This indicator is used to help identify short-term trends in the market and can signal potential buying or selling opportunities.
To apply the CPR strategy, traders first look for Inside Candles on their chart, indicating a period of consolidation or indecision in the market. Next, they identify the Pivot Points for the current trading day, which can act as potential areas of support or resistance. Finally, traders use the 4EMA to confirm the direction of the trend and potential entry or exit points.
For example, if an Inside Candle forms at a Pivot Point level and the 4EMA is indicating an uptrend, this could be a potential buying opportunity. Conversely, if an Inside Candle forms at a Pivot Point level and the 4EMA is indicating a downtrend, this could be a potential selling opportunity.

CPR by Anand with PDL/PDH & Breakouts 15/30 minsThis is an enhanced version of CPR by Anand with Configurable previous day high and low and option to configure breakout lines of 15 and 30 mins.
Will be an useful tool for day traders who follows CPR tricks and breakouts.

CPR Call-Out Panel (Daily + Weekly Context)Use on 5 minute chart along with CPR by KGS indicator. My script helps to interpret potential nifty 50 index behaviour based on levels. DM for more questions.

CPR PIVOT, 2ST, 5MA, VWAPSUPERTREND
2 supertrend with diffrent patameters.
MOVING AVERAGE RIBBON
5 differenT EMA
VWAP
Simple vwap with bands nothing special
every parameters and looks can be change
AND CPR
CPR-EMA(8,20,200)The intention behind this Indicator is to combine 2 (EMA & CPR) together so that users having limits on the number of indicators can be benifited