The Magic LineThis script is based on the simple 2 or 3 candle entry model taught by Armando "The Professor".
This strategy will work best on the 1hr timeframe or higher and you can also add a MA on your chart to identify direction of trend and trade with the trend. For example, if price is above the 50 SMA, you can opt to only look for 'buy' signals. If price is below the 50 SMA, you can opt to only look for 'sell' signals.
The default setting is to wait for 3 consecutive candles of either bullish or bearish sentiment before printing a buy or sell signal. This can be changed to any number you would like but typically 3 works best, as long as you're using the 1hr timeframe or higher.
Ex: If there are 3 green (bullish) candles print in a row, a 'sell' signal will print, and the entry line will be one tick below the open of the previous green candle. You can use that line as your entry.
For your stop loss, you can try to use the most recent swing high (for sells) or swing low (for buys). You can also use nearby support/resistance levels, or even the PSAR as another way to determine your stop loss.
If there are more than 3 consecutive candles with the same sentiment, signals will continue to print until the streak ends at which point the counter will restart, and the idea is to take the most recent signal as your entry. Limit/Stop entries work best as you can just let price come down to the signal line that is drawn.
Comment below if you have any questions! Good luck!
Recherche dans les scripts pour "entry"

TSI w SuperTrend decision - Strategy [presentTrading]This strategy aims to improve upon the performance of Traidngview's newly published "Trend Strength Index" indicator by incorporating the SuperTrend for better trade execution and risk management. Enjoy :)
█ Introduction and How it is Different
The "TSI with SuperTrend Decision - Strategy" combines the Trend Strength Index (TSI) with SuperTrend indicators to determine entry and exit points. Unlike traditional strategies that rely solely on one indicator, this method leverages the strengths of both TSI and SuperTrend to provide a more nuanced and adaptive trading strategy.
This dual approach allows for capturing trends more effectively, especially in volatile markets.
BTCUSD 8h LS Performance
█ Strategy, How it Works: Detailed Explanation
🔶 Trend Strength Index (TSI)
The TSI is a momentum oscillator that shows both the direction and strength of a trend. It is calculated by comparing the price movement with the bar index over a specified period. The formula for TSI is as follows:
```
TSI = (PC / |PC|)
where:
PC = Change in price over the period
```
In this strategy, TSI is calculated using the closing prices and a default period of 64 bars. The TSI values help identify overbought and oversold conditions, providing signals for potential market reversals.
🔶 SuperTrend Indicator
The SuperTrend is a trend-following indicator based on the average true range (ATR). It helps in identifying the direction of the market trend. The SuperTrend calculation involves:
```
SuperTrend = HLC3 ± (Factor * ATR)
where:
HLC3 = (High + Low + Close) / 3
Factor = User-defined multiplier
ATR = Average True Range over a period
```
The SuperTrend settings in this strategy include a length of 10 bars and a factor of 3.0.
Last Bull Cycle of BTC
🔶 Entry and Exit Conditions
The strategy uses the TSI and SuperTrend together to determine entry and exit points:
- Long Entry: When the SuperTrend indicates a downward trend (st.d < 0) and the TSI is above the oversold level (-0.241).
- Long Exit: When the SuperTrend indicates an upward trend (st.d > 0) and the TSI is below the overbought level (0.241).
- Short Entry: When the SuperTrend indicates an upward trend (st.d > 0) and the TSI is below the overbought level (0.241).
- Short Exit: When the SuperTrend indicates a downward trend (st.d < 0) and the TSI is above the oversold level (-0.241).
█ Trade Direction
The strategy allows users to select the trade direction through the `tradeDirection` input. The options are:
- Both: Enables both long and short trades.
- Long: Enables only long trades.
- Short: Enables only short trades.
█ Default Settings
- TSI Length: 64
- SuperTrend Length: 10
- SuperTrend Factor: 3.0
- Trade Direction: Both
- Take Profit (%): 30.0
- Stop Loss (%): 20.0
Impact of Default Settings
- TSI Length: A longer TSI period smooths out noise but may lag in identifying trends. A shorter period is more responsive but can generate false signals.
- SuperTrend Length: A shorter length provides quicker signals but can be prone to whipsaws. A longer length is more reliable but may delay entries and exits.
- SuperTrend Factor: A higher factor increases the distance of the SuperTrend from the price, reducing sensitivity to minor price fluctuations.
- Trade Direction: Allows flexibility in trading strategies by enabling both long and short trades based on market conditions.
- Take Profit and Stop Loss: These settings manage risk by automatically closing trades at predefined profit or loss levels. Higher percentages provide larger potential gains but also higher risk.

CCI and MACD Auto Trading Strategy with Risk/RewardOverview:
This strategy combines the Commodity Channel Index (CCI) and the Moving Average Convergence Divergence (MACD) indicators to automate trading decisions. It dynamically sets stop-loss and take-profit levels based on recent lows and highs, ensuring a risk/reward ratio of 1:1.5. This script aims to leverage trend and momentum signals while maintaining effective risk management.
Originality and Usefulness:
This script is not just a simple mashup of CCI and MACD indicators; it incorporates dynamic risk management by setting stop-loss and take-profit levels based on recent price action. This approach helps traders to:
・Identify potential trend reversals using the combination of CCI and MACD signals.
・Manage trades effectively by setting realistic stop-loss and take-profit levels based on recent market data.
・Maintain a balanced risk/reward ratio, which is essential for sustainable trading.
Indicators Used:
・CCI (Commodity Channel Index):
・Measures the deviation of the price from its average over a specified period, typically ranging from -100 to +100.
・Helps identify overbought and oversold conditions.
・MACD (Moving Average Convergence Divergence):
・Utilizes the difference between short-term and long-term moving averages to indicate trend strength and direction.
・Provides momentum signals that can be used for timing entries and exits.
How It Works:
Entry Conditions:
Long Entry:
・The MACD histogram is above zero.
・The CCI crosses above the -100 line.
Short Entry:
・The MACD histogram is below zero.
・The CCI crosses below the +100 line.
Exit Conditions:
Long Positions:
・The stop-loss is set at the recent low.
・The take-profit is set at 1.5 times the distance between the entry price and the stop-loss.
Short Positions:
・The stop-loss is set at the recent high.
・The take-profit is set at 1.5 times the distance between the entry price and the stop-loss.
Risk Management:
・The script dynamically adjusts stop-loss and take-profit levels based on recent market data, ensuring that the risk/reward ratio is maintained at 1:1.5.
・This approach helps in managing the risk effectively while aiming for consistent profits.
Strategy Properties:
・Account Size: Configured for a realistic account size suitable for the average trader.
・Commission and Slippage: Includes settings for realistic commission and slippage to reflect real market conditions.
・Risk per Trade: Designed to risk no more than 5-10% of equity per trade, aligning with sustainable trading practices.
・Backtesting Results: Configured to generate a sufficient sample size (ideally more than 100 trades) for reliable backtesting results.
Revised Backtesting Settings
Ensure that your backtesting settings are realistic:
・Account Size: Set a realistic initial capital suitable for the average trader.
・Commission and Slippage: Include realistic commission fees and slippage.
・Risk Management: Ensure that each trade risks no more than 5-10% of the account equity.
・Sufficient Sample Size: Choose a dataset that will generate more than 100 trades to provide a robust sample size.

Smart Money Concept Strategy - Uncle SamThis strategy combines concepts from two popular TradingView scripts:
Smart Money Concepts (SMC) : The strategy identifies key levels in the market (swing highs and lows) and draws trend lines to visualize potential breakouts. It uses volume analysis to gauge the strength of these breakouts.
Smart Money Breakouts : This part of the strategy incorporates the idea of "Smart Money" – institutional traders who often lead market movements. It looks for breakouts of established levels with significant volume, aiming to catch the beginning of new trends.
How the Strategy Works:
Identification of Key Levels: The script identifies swing highs and swing lows based on a user-defined lookback period. These levels are considered significant points where price has reversed in the past.
Drawing Trend Lines: Trend lines are drawn connecting these key levels, creating a visual representation of potential support and resistance zones.
Volume Analysis: The script analyzes the volume during the formation of these levels and during breakouts. Higher volume suggests stronger moves and increases the probability of a successful breakout.
Entry Conditions:
Long Entry: A long entry is triggered when the price breaks above a resistance line with significant volume, and the moving average trend filter (optional) is bullish.
Short Entry: A short entry is triggered when the price breaks below a support line with significant volume, and the moving average trend filter (optional) is bearish.
Exit Conditions:
Stop Loss: Customizable stop loss percentages are implemented to protect against adverse price movements.
Take Profit: Customizable take profit percentages are used to lock in profits.
Credits and Compliance:
This strategy is inspired by the concepts and code from "Smart Money Concepts (SMC) " and "Smart Money Breakouts ." I've adapted and combined elements of both scripts to create this strategy. Full credit is given to the original authors for their valuable contributions to the TradingView community.
To comply with TradingView's House Rules, I've made the following adjustments:
Clearly Stated Inspiration: The description explicitly mentions the original scripts and authors as the inspiration for this strategy.
No Direct Copying: The code has been modified and combined, not directly copied from the original scripts.
Educational Purpose: The primary purpose of this strategy is for learning and backtesting. It's not intended as financial advice.
Important Note:
This strategy is intended for educational and backtesting purposes only. It should not be used for live trading without thorough testing and understanding of the underlying concepts. Past performance is not indicative of future results.

Advanced Gold Scalping Strategy with RSI Divergence# Advanced Gold Scalping Strategy with RSI Divergence
## Overview
This Pine Script implements an advanced scalping strategy for gold (XAUUSD) trading, primarily designed for the 1-minute timeframe. The strategy utilizes the Relative Strength Index (RSI) indicator along with its moving average to identify potential trade setups based on divergences between price action and RSI movements.
## Key Components
### 1. RSI Calculation
- Uses a customizable RSI length (default: 60)
- Allows selection of the source for RSI calculation (default: close price)
### 2. Moving Average of RSI
- Supports multiple MA types: SMA, EMA, SMMA (RMA), WMA, VWMA, and Bollinger Bands
- Customizable MA length (default: 3)
- Option to display Bollinger Bands with adjustable standard deviation multiplier
### 3. Divergence Detection
- Implements both bullish and bearish divergence identification
- Uses pivot high and pivot low points to detect divergences
- Allows for customization of lookback periods and range for divergence detection
### 4. Entry Conditions
- Long Entry: Bullish divergence when RSI is below 40
- Short Entry: Bearish divergence when RSI is above 60
### 5. Trade Management
- Stop Loss: Customizable, default set to 11 pips
- Take Profit: Customizable, default set to 33 pips
### 6. Visualization
- Plots RSI line and its moving average
- Displays horizontal lines at 30, 50, and 70 RSI levels
- Shows Bollinger Bands when selected
- Highlights divergences with "Bull" and "Bear" labels on the chart
## Input Parameters
- RSI Length: Adjusts the period for RSI calculation
- RSI Source: Selects the price source for RSI (close, open, high, low, hl2, hlc3, ohlc4)
- MA Type: Chooses the type of moving average applied to RSI
- MA Length: Sets the period for the moving average
- BB StdDev: Adjusts the standard deviation multiplier for Bollinger Bands
- Show Divergence: Toggles the display of divergence labels
- Stop Loss: Sets the stop loss distance in pips
- Take Profit: Sets the take profit distance in pips
## Strategy Logic
1. **RSI Calculation**:
- Computes RSI using the specified length and source
- Calculates the chosen type of moving average on the RSI
2. **Divergence Detection**:
- Identifies pivot points in both price and RSI
- Checks for higher lows in RSI with lower lows in price (bullish divergence)
- Checks for lower highs in RSI with higher highs in price (bearish divergence)
3. **Trade Entry**:
- Enters a long position when a bullish divergence is detected and RSI is below 40
- Enters a short position when a bearish divergence is detected and RSI is above 60
4. **Position Management**:
- Places a stop loss order at the entry price ± stop loss pips (depending on the direction)
- Sets a take profit order at the entry price ± take profit pips (depending on the direction)
5. **Visualization**:
- Plots the RSI and its moving average
- Draws horizontal lines for overbought/oversold levels
- Displays Bollinger Bands if selected
- Shows divergence labels on the chart for identified setups
## Usage Instructions
1. Apply the script to a 1-minute XAUUSD (Gold) chart in TradingView
2. Adjust the input parameters as needed:
- Increase RSI Length for less frequent but potentially more reliable signals
- Modify MA Type and Length to change the sensitivity of the RSI moving average
- Adjust Stop Loss and Take Profit levels based on current market volatility
3. Monitor the chart for Bull (long) and Bear (short) labels indicating potential trade setups
4. Use in conjunction with other analysis and risk management techniques
## Considerations
- This strategy is designed for short-term scalping and may not be suitable for all market conditions
- Always backtest and forward test the strategy before using it with real capital
- The effectiveness of divergence-based strategies can vary depending on market trends and volatility
- Consider using additional confirmation signals or filters to improve the strategy's performance
Remember to adapt the strategy parameters to your risk tolerance and trading style, and always practice proper risk management.

Prometheus Polarized Fractal Efficiency (PFE)This indicator uses market data to calculate Polarized Fractal Efficiency (PFE) on an asset, so traders can have a better idea of which direction it may go.
Users can control the lookback length for the fractal calculation, the lookback length for the Exponential Moving Average (EMA), and whether or not to display lines at the -50 and 50 level, or -25 and 25 level.
Polarized Fractal Efficiency:
The Polarized Fractal Efficiency (PFE) indicator is a value between -100 and 100 with 0 as a midpoint.
A PFE above 0 indicates the asset may trend higher, a PFE below 0 indicates the asset may trend lower.
There are many ways to trade with PFE, the intuitive trend riding as described above, or reversals.
Even when the PFE is above 0, if it gets high enough, it may also be an indication of a reversal. A PFE of 90 - 100, or -100 - -90, may indicate price is ready to revert the other direction. Furthermore, traders already in a position may look to breaks of other levels to be their take profit or stop out spot.
Calculation:
Pi = 100 x (Price - Price )2 + N2 / Summation, j= 0, to N-2 (Price - Price )2 + 1
If Close < Close Pi = -Pi
PFEi = EMA(Pi, M)
Where:
N = period of indicator
M = smoothing period
Citation: www.investopedia.com
Scenarios:
Inputs are (9, 5) and every display option is on.
Trend example
Step 1: A short trade appears as PFE crosses below -25. We reach a safe take profit as PFE crosses below -50. Traders can use these levels to exit as well as enter.
Step 2: On the cross above 25 there is a safe long. As the PFE value breaks 0 a safe, early take profit could be appropriate for this trade. No guarantee we would see 50.
Step 3: Long scenario at break of 25, straight to 50. Simple, straightforward setup.
Step 4: This long results in a stop loss. Once again entry as PFE crosses 25, but as we cross the 0 line it is for a loss.
Step 5: The last trade in this example is reminiscent of step 3. This is a short trade entry at break of 25 and exit at break of 50.
Traders have liberty to use the PFE value to determine spots to enter and exit trades, long or short. 25 and 50 were chosen arbitrarily, values like 10 and 60 may work as well, we encourage traders to use their own discretion along with tools.
Reversal example
Step 1: PFE is around -100, crossing below it at one point! Strong zone for a potential reversal.
Step 2: PFE crosses above 25 adding conviction.
Step 3: Option to exit at 70.
Step 4: Option to exit at 90.
There is no “one size fits all method”, this approach may be more intuitive for some users and is just as feasible as the first.
Longer trend example
Step 1: Using -50 and 50 this time instead of -25 and 25 to be safer on our entries we see a short here. Was a good entry and as the value gets closer to -70 we can safely close.
Step 2: On this candle we see a long for the break of 50. On the next candle we break the 0 line, but because of our safe entry at 50, we could hold this and only stop out at a break of -25. We get close but stay in it and close at 70.
Step 3: Break of 50 for a long once again. This time the break of 0 line occurs as we are in profit, not letting a green trade go red is a golden rule of trading, so an early exit here.
Step 4: Same at step 2, break of 50 to long and stay in it, not stopping out at break of 0 line. The PFE value eventually reaches 70 and there is a good exit.
Quicker Reversal example
Step 1: Notice a close with PFE below -90, enter long for the reversal. Then close for profit when the PFE crosses above 70.
Step 2: When the PFE breaks above 90 we have a short entry. Like the long closing it when it crosses below -70.
Step 3: This step is the same setup as step 2. As PFE breaks above 90 we have a short entry. Closing it when it crosses below -70.
Recap:
Described above are 4 different examples with many different trades. Both trend and reversal trades. The PFE value is an indicator that can be used by traders in many different ways and Prometheus encourages traders to use their own discretion along with tools and not follow indicators blindly.
Options:
Users can control the input for the lookback of the indicator. The default is 9.
The smoothing factor for the EMA is also changeable, default is 5.
Users have options to display lines at -50, -25, 25, and 50.

KumoTrade Ichimoku StrategyThe KumoTrade Ichimoku Strategy is an advanced trading strategy designed to help users identify market trends and potential trading opportunities using the Ichimoku Kinko Hyo technical analysis indicator. This strategy leverages the Ichimoku cloud (Kumo) along with other crucial indicators such as the Tenkan-sen and Kijun-sen lines to generate strong signals.
Main Components of the Strategy:
Tenkan-sen (Conversion Line): Indicates the short-term direction of the price, typically calculated as the average of the highest high and the lowest low over the past 9 periods.
Kijun-sen (Base Line): Indicates the medium-term direction of the price, usually calculated as the average of the highest high and the lowest low over the past 26 periods.
Senkou Span A and Senkou Span B: These two lines form the cloud (Kumo), which projects future support and resistance levels.
Chikou Span (Lagging Span): Plots the current closing price 26 periods back to measure the market's momentum.
Strategy Rules:
Bullish Bias (Bias Bull): Indicates that the prices are in a long-term uptrend. In this strategy, this is confirmed if the low prices are above the daily EMA (Exponential Moving Average).
Kijun Sen Touch Down: Occurs when prices cross below the Kijun-sen line and then close back above it, indicating a potential bullish reversal.
Tenkan-Kijun Cross Up: A bullish signal generated when the Tenkan-sen line crosses above the Kijun-sen line.
Close Over Tenkan and Kijun: A strong bullish signal when the close price crosses above both the Tenkan-sen and Kijun-sen lines.
Trading Setups:
Long Setup: Generated when the Kijun-sen is above the highest point of the Kumo (senkou_max) and the closing price is below the lowest point of the Kumo (senkou_min). This setup is checked over the last 21 bars.
Short Setup: Generated when the Kijun-sen is below the lowest point of the Kumo (senkou_min) and the closing price is above the highest point of the Kumo (senkou_max). This setup is also checked over the last 21 bars. (Not avalible yet)
Entry Conditions:
Ultra Long Entry: This condition checks for a bullish bias, the Tenkan-Kijun cross up or Kijun Sen touch down, high volume, and that the price is not within the Kumo cloud.
Main Long Entry: This condition requires the closing price to be above the Kumo cloud, a green Kumo cloud, a bullish bias, the Tenkan rule, and that the price is not within the Kumo cloud.
Exit Conditions:
A trailing stop loss is implemented to protect profits. The stop loss level is dynamically updated based on the highest high of the last 5 bars minus three times the ATR (Average True Range) value.
Visuals on the Chart:
The Tenkan-sen and Kijun-sen lines are plotted for visual reference.
The Kumo cloud is displayed with different colors indicating bullish (green) or bearish (red) conditions.
Entry points are marked on the chart, and the trailing stop loss levels are plotted as well.
The KumoTrade Ichimoku Strategy aims to provide a comprehensive approach to trading by combining multiple aspects of the Ichimoku indicator to generate reliable trading signals and manage risk effectively.

VWAP Suite, Session Cloud RevOverview
The VWAP Suite with Standard Deviation Strategy is a comprehensive indicator designed to help traders make informed trading decisions based on the Volume Weighted Average Price (VWAP) and its associated standard deviation bands. This indicator provides multiple VWAP calculations for different timeframes (Session, Day, Week, Month) and incorporates standard deviation bands to identify potential trade entry and exit points.
Components
VWAP Calculation:
Session VWAP: VWAP calculated based on the current trading session.
Day VWAP: VWAP calculated for the daily timeframe.
Week VWAP: VWAP calculated for the weekly timeframe.
Month VWAP: VWAP calculated for the monthly timeframe.
Standard Deviation Bands:
The indicator includes three standard deviation bands (StDev 1, StDev 2, and StDev 3) around the VWAP. These bands help identify the dispersion of price from the VWAP, providing insight into potential overbought or oversold conditions.
Additional VWAP Lines:
VWAP 2: An additional VWAP line with a customizable timeframe (Day, Week, Month).
VWAP 3: Another VWAP line for further analysis with a customizable timeframe (Day, Week, Month).
Strategy Description
The primary strategy implemented in this indicator revolves around the second standard deviation band (StDev 2). The key aspects of this strategy include:
Entry Points:
Long Entry: Consider entering a long position when the price moves below the lower StDev 2 band and then starts to revert back towards the VWAP. This indicates a potential oversold condition.
Short Entry: Consider entering a short position when the price moves above the upper StDev 2 band and then starts to revert back towards the VWAP. This indicates a potential overbought condition.
Exit Points:
Long Exit: Exit the long position when the price moves back up to the VWAP or the upper StDev 1 band, indicating a normalization of the price.
Short Exit: Exit the short position when the price moves back down to the VWAP or the lower StDev 1 band, indicating a normalization of the price.
Risk Management:
Set stop-loss levels slightly beyond the StDev 3 bands to protect against significant adverse price movements.
Use trailing stops to lock in profits as the price moves favorably.
Customization
The VWAP Suite allows for extensive customization, enabling traders to adjust the following settings:
VWAP Mode: Select the timeframe for the primary VWAP calculation (Session, Day, Week, Month).
Line Widths and Colors: Customize the line widths and colors for VWAP and standard deviation bands.
Fill Opacity: Adjust the opacity of the fill between standard deviation bands for better visual clarity.
Additional VWAPs: Enable and customize additional VWAP lines (VWAP 2 and VWAP 3) for further analysis.
Volume-Supported Linear Regression Trend Modified StrategyHi everyone, this will be my first published script on Tradingview, maybe more to come.
For quite some time I have been looking for a script that performs no matter if price goes up or down or sideways. I believe this strategy comes pretty close to that. Although nowhere near the so called "buy&hold equity" of BTC, it has produced consistent profits even when price goes down.
It is a strategy which seems to work best on the 1H timeframe for cryptocurrencies.
Just by testing different settings for SL and TP you can customize it for each pair.
THE STRATEGY:
Basically, I used the Volume Supported Linear Regression Trend Model that LonesomeTheBlue has created and modified a few things such as entry and exit conditions. So all credits go to him!
LONG ENTRY: When there is a bullish cross of the short term trend (the histogram/columns), while the long term trend is above 0 and rising.
SHORT ENTRY: When there is a bearish cross (green to red) of the short-term trend (the histogram/columns), while the long term trend is beneath 0 and decreasing.
LONG EXIT: Bearish crossover of short-term trend while long term trend is below 0
SHORT EXIT: Bullish crossover of short-term trend while long term trend is above 0
Combining this with e.g. a SL of 2% and a TP of 20% (as used in my backtesting), combined with pyramiding and correct risk management, it gives pretty consistent results.
Be aware, this is only for educational purpose and in no means financial advise. Past results do not guarantee future results. This strategy can lose money!
Enjoy :)
PS: It works not only on BTC of course, works even better on some other major crypto pairs. I'll leave it to you to find out which ones ;)
Fibonacci Trend Reversal StrategyIntroduction
This publication introduces the " Fibonacci Retracement Trend Reversal Strategy, " tailored for traders aiming to leverage shifts in market momentum through advanced trend analysis and risk management techniques. This strategy is designed to pinpoint potential reversal points, optimizing trading opportunities.
Overview
The strategy leverages Fibonacci retracement levels derived from @IMBA_TRADER's lance Algo to identify potential trend reversals. It's further enhanced by a method called " Trend Strength Over Time " (TSOT) (by @federalTacos5392b), which utilizes percentile rankings of price action to measure trend strength. This also has implemented Dynamic SL finder by utilizing @veryfid's ATR Stoploss Finder which works pretty well
Indicators:
Fibonacci Retracement Levels : Identifies critical reversal zones at 23.6%, 50%, and 78.6% levels.
TSOT (Trend Strength Over Time) : Employs percentile rankings across various timeframes to gauge the strength and direction of trends, aiding in the confirmation of Fibonacci-based signals.
ATR (Average True Range) : Implements dynamic stop-loss settings for both long and short positions, enhancing trade security.
Strategy Settings :
- Sensitivity: Set default at 18, adjustable for more frequent or sparse signals based on market volatility.
- ATR Stop Loss Finder: Multiplier set at 3.5, applying the ATR value to determine stop losses dynamically.
- ATR Length: Default set to 14 with RMA smoothing.
- TSOT Settings: Hard-coded to identify percentile ranks, with no user-adjustable inputs due to its intrinsic calculation method.
Trade Direction Options : Configurable to support long, short, or both directions, adaptable to the trader's market assessment.
Entry Conditions :
- Long Entry: Triggered when the price surpasses the mid Fibonacci level (50%) with a bullish TSOT signal.
- Short Entry: Activated when the price falls below the mid Fibonacci level with a bearish TSOT indication.
Exit Conditions :
- Employs ATR-based dynamic stop losses, calibrated according to current market volatility, ensuring effective risk management.
Strategy Execution :
- Risk Management: Features adjustable risk-reward settings and enables partial take profits by default to systematically secure gains.
- Position Reversal: Includes an option to reverse positions based on new TSOT signals, improving the strategy's responsiveness to evolving market conditions.
The strategy is optimized for the BYBIT:WIFUSDT.P market on a scalping (5-minute) timeframe, using the default settings outlined above.
I spent a lot of time creating the dynamic exit strategies for partially taking profits and reversing positions so please make use of those and feel free to adjust the settings, tool tips are also provided.
For Developers: this is published as open-sourced code so that developers can learn something especially on dynamic exits and partial take profits!
Good Luck!
Disclaimer
This strategy is shared for educational purposes and must be thoroughly tested under diverse market conditions. Past performance does not guarantee future results. Traders are advised to integrate this strategy with other analytical tools and tailor it to specific market scenarios. I was only sharing what I've crafted while strategizing over a Solana Meme Coin.

BBSR Extreme Strategy [nachodog]The Bollinger Bands Stochastic RSI Extreme Strategy is a comprehensive trading approach designed for use on the TradingView platform, employing a combination of Bollinger Bands and the Stochastic RSI to identify potential entry and exit points in the market. This strategy is converted into Pine Script version 5 and is specifically tailored as a strategy rather than a mere study, allowing traders to simulate and backtest their trades within the TradingView environment.
Strategy Overview:
Bollinger Bands serve as the primary tool for volatility and price level analysis. By calculating the standard deviation of price movements around a simple moving average (SMA), this strategy identifies the upper and lower bounds of price fluctuations, helping traders spot potential reversal points.
Stochastic RSI is used to gauge the momentum by comparing the closing price's position relative to its price range over a certain period. This indicator helps in determining overbought or oversold conditions, providing insights into potential bullish or bearish momentum.
Entry Signals:
Bullish Entry: The strategy signals a long entry when the price moves from below to above the lower Bollinger Band, coupled with a Stochastic RSI indicating an exit from oversold conditions. This suggests an uptrend initiation, prompting a buy order.
Bearish Entry: Conversely, a short entry is signaled when the price drops from above to below the upper Bollinger Band while the Stochastic RSI moves from overbought territory. This condition indicates a potential downtrend, triggering a sell order.
Exit Criteria:
Stop Loss: A key feature of this strategy is the inclusion of a user-defined stop loss percentage, which helps manage risk by specifying the maximum allowable loss per trade.
Bearish Exit for Long Positions: Long positions are exited either when a bearish signal is detected or when the price crosses below the lower Bollinger Band, suggesting a reversal or weakening of the bullish trend.
Bullish Exit for Short Positions: Short positions are closed upon a bullish signal or when the price crosses above the upper Bollinger Band, indicating a potential reversal or diminishing bearish momentum.
Strategy Benefits:
The strategy provides a structured framework for entering and exiting trades, leveraging the strengths of both Bollinger Bands and Stochastic RSI.
It includes parameters for customization, such as the stop loss percentage, allowing traders to align the strategy with their risk tolerance and trading objectives.
The ability to backtest and simulate trades on TradingView enhances its utility, offering insights into the strategy's performance under historical market conditions.
Overall, the Bollinger Bands Stochastic RSI Extreme Strategy is designed for traders who seek to capitalize on trend reversals and momentum shifts, with built-in risk management features to safeguard against significant losses.
Big RunnerPresenting the "Big Runner" technique, dubbed "Sprinter," which is intended to help traders looking for momentum chances recognise important market swings. This approach maximises profit potential while controlling risk by using trend ribbons and moving averages to identify entry and exit locations.
Important characteristics:
Moving Averages: To determine the direction of the underlying trend, moving averages, both rapid and slow, are used. Depending on their preferred trading strategy, traders can alter the duration of these averages.
Trend Ribbon: Shows phases of bullish and bearish momentum by using a ribbon indicator to visualise the strength of the trend. Trend transitions are simple to spot for traders so they can make wise decisions.
Buy and Sell Signals: This tool generates buy and sell signals that indicate possible entry and exit opportunities based on the crossing and crossunder of moving averages.
Stop Loss/Take Profit Management: This feature enables traders to successfully apply risk management methods by giving them the ability to set stop loss and take profit levels as a percentage of the entry price.
Dynamic Position Sizing: Optimises capital allocation for every trade by dynamically calculating position size depending on leverage and portfolio proportion.
Implementation:
Long Entry: Started when a bullish trend is indicated by a price cross above the fast and slow moving averages. To control risk and lock in earnings, stop loss and take profit thresholds are established appropriately.
Short Entry: Indicates a bearish trend when the price crosses below both moving averages. The concepts of risk management are similar, with dynamic calculations used to determine take-profit and stop-loss levels.
Extra Personalisation:
Take Profit/Stop Loss Management: Provides the ability to select a take profit and stop loss
API Integration: This feature improves execution flexibility and efficiency by enabling traders to include custom parameters for automated trading.
Notice:
Trading entails risk, and performances in the past do not guarantee future outcomes. Before making any trades with this approach, careful analysis and risk management are necessary.
In summary:
By integrating risk management procedures with technical indicators, the "Big Runner" strategy provides a thorough method for identifying noteworthy market changes and achieving the best possible trading results. Traders can adjust parameters to suit their interests and style of trading, giving them the confidence to traverse volatile market situations.
Inside Candle StrategyIntroduction
The Inside Candle Breakout Strategy leverages the concept of inside candles as a primary signal for potential breakouts. Unlike common trend-following or scalping strategies, this method focuses on the volatility squeeze indicated by inside candles and aims to capture the momentum that follows these periods of consolidation. The strategy's originality lies in its specific integration of timeframes for signal detection and its application across diverse market conditions without relying on conventional trend indicators.
Strategy Description and Mechanics
Inside Candle Identification: At the heart of this strategy is the detection of inside candles, defined as candles fully contained within the range of the preceding candle. This pattern signifies a temporary balance between buyers and sellers, often preceding significant price movements. The strategy scans for these candles within a user-specified timeframe in the input section of the settings of the strategy, allowing for tailored signal generation based on individual trading preferences.
Entry Points and Market Entries: Upon identifying an inside candle and only once this candle closes, the strategy prepares to enter a trade in the direction of the breakout. Trades are executed in the timeframe selected on the chart, ensuring that entry points are aligned with real-time market movements. This process highlights the strategy's adaptability, making it suitable for various trading styles, from day trading to swing trading.
Overlay Indicator for Enhanced Market Analysis: Accompanying the breakout signals is an overlay indicator comprising two moving averages and a volatility cloud. This feature serves as a secondary tool for market analysis, offering insights into the prevailing market trend and volatility levels. While it doesn't influence the entry or exit signals directly, it provides traders with additional context for refining their decisions, enhancing the strategy's utility. This assistance tool is composed by one moving average and a second line which is calculated adding or subtracting the historical volatility of the asset on the moving average, depending on his momentum.
Strategy Results and Commitment to Realism
Backtesting Protocol: In our commitment to transparency and realism, backtesting results are derived from a dataset that ensures a sufficient number of trades (over 100) to validate the strategy's effectiveness. This approach underscores our dedication to providing traders with reliable and actionable insights.
Risk Management and Trade Sizing: Recognizing the importance of sustainable trading practices, the strategy incorporates strict risk management guidelines. Trades are sized to ensure that only a small percentage of equity is risked on a single trade, adhering to widely accepted risk tolerance levels. The initial account size for this script is set to 10000$.
Strategy Defaults and Justification: The default properties of the strategy, including the risk-reward ratio, average length for moving averages, and other parameters, are carefully chosen based on extensive testing and analysis. These settings represent a balanced approach, aiming to optimize the strategy's performance across a variety of market conditions.
Strategy Components:
- Inside Candles: An inside candle occurs when a candle's high and low are completely contained within the high and low of the previous candle. This pattern indicates a period of consolidation or indecision in the market, often preceding a significant price movement. The strategy detects inside candles based on the user-selected timeframe, allowing traders to capture potential breakouts.
Indicator Overlays:
- Moving Average: A simple moving average (SMA) is calculated over a user-defined length (`Average Length`), providing a dynamic baseline to gauge the market's direction. The strategy offers an option (`Show Moving Average`) to display or hide this moving average on the chart, giving traders control over the visual complexity.
- Volatility Measurement: Alongside the moving average, the strategy assesses market volatility using the standard deviation of the closing prices over the same period defined by the `Average Length`. The moving average is adjusted upwards or downwards by this volatility measure, creating a dynamic channel that reflects the current market conditions.
- Color Gradients for Volatility: The strategy uses a color gradient to fill the area between the moving average and its volatility-adjusted counterpart. This gradient visually represents the volatility level, transitioning from gray (low volatility) to a lighter shade (higher volatility), aiding in the assessment of market sentiment and volatility.
Trading Entries:
- Long Entry: A long position is triggered when the closing price exceeds the high of an inside candle, indicating potential bullish momentum. The strategy places a stop-loss at the low of the inside candle and sets a take-profit level based on the predefined risk-reward ratio (`RR Ratio`).
- Short Entry: Conversely, a short position is initiated when the closing price falls below the low of an inside candle, suggesting bearish pressure. A stop-loss is set at the high of the inside candle, with the take-profit level adjusted according to the risk-reward ratio.
Customization Settings:
- Timeframe: Traders can select the desired timeframe for inside candle detection, tailoring the strategy to fit various trading styles and time horizons.
- RR Ratio: The risk-reward ratio is adjustable, allowing traders to manage the potential risk and return of each trade according to their risk tolerance.
- Average Length: This setting determines the period over which the moving average and volatility are calculated, affecting the sensitivity of the strategy to price movements.
- Visual Settings: Users can customize the appearance of the strategy on their charts, including the colors of the moving average and volatility lines, as well as the line width, enhancing chart readability and personal preference adherence.
Disclaimer
Trading involves significant risk, and it is crucial for traders to conduct their own due diligence before engaging with any strategy. The Inside Candle Breakout Strategy is presented for informational purposes only and does not constitute financial advice.

Aroon and ASH strategy - ETHERIUM [IkkeOmar]Intro:
This post introduces a Pine Script strategy, as an example if anyone needs a push to get started. This example is a strategy on ETH, obviously it isn't a good strategy, and I wouldn't share my own good strategies because of alpha decay. This strategy combines two technical indicators: Aroon and Absolute Strength Histogram (ASH).
Overview:
The strategy employs the Aroon indicator alongside the Absolute Strength Histogram (ASH) to determine market trends and potential trade setups. Aroon helps identify the strength and direction of a trend, while ASH provides insights into the strength of momentum. By combining these indicators, the strategy aims to capture profitable trading opportunities in Ethereum markets. Normally when developing strats using indicators, you want to find some good indicators, but you NEED to understand their strengths and weaknesses, other indicators can be incorporated to minimize the downs of another indicator. Try to look for synergy in your indicators!
Indicator settings:
Aroon Indicator:
- Two sets of parameters are used for the Aroon indicator:
- For Long Positions: Aroon periods are set to 56 (upper) and 20 (lower).
- For Short Positions: Aroon periods are set to 17 (upper) and 55 (lower).
Absolute Strength Histogram (ASH):
ASH is calculated with a length of 9 bars using the closing price as the data source.
Trading Conditions:
The strategy incorporates specific conditions to initiate and exit trades:
Start Date:
Traders can specify the start date for backtesting purposes.
Trade Direction:
Traders can select the desired trade direction: Long, Short, or Both.
Entry and Exit Conditions:
1. Long Position Entry: A long position is initiated when the Aroon indicator crosses over (crossover) the lower Aroon threshold, indicating a potential uptrend.
2. Long Position Exit: A long position is closed when the Aroon indicator crosses under (crossunder) the lower Aroon threshold.
3. Short Position Entry: A short position is initiated when the Aroon indicator crosses under (crossunder) the upper Aroon threshold, signaling a potential downtrend.
4. Short Position Exit: A short position is closed when the Aroon indicator crosses over (crossover) the upper Aroon threshold.
Disclaimer:
THIS ISN'T AN OPTIMAL STRATEGY AT ALL! It was just an old project from when I started learning pine script!
The backtest doesn't promise the same results in the future, always do both in-sample and out-of-sample testing when backtesting a strategy. And make sure you forward test it as well before implementing it!

FlexiMA x FlexiST - Strategy [presentTrading]█ Introduction and How it is Different
The FlexiMA x FlexiST Strategy blends two analytical methods - FlexiMA and FlexiST, which are opened in my early post.
- FlexiMA calculates deviations between an indicator source and a dynamic moving average, controlled by a starting factor and increment factor.
- FlexiST, on the other hand, leverages the SuperTrend model, adjusting the Average True Range (ATR) length for a comprehensive trend-following oscillator.
This synergy offers traders a more nuanced and multifaceted tool for market analysis.
BTC 6H L/S Performance
Local
█ Strategy, How It Works: Detailed Explanation
The strategy combines two components: FlexiMA and FlexiST, each utilizing unique methodologies to analyze market trends.
🔶FlexiMA Component:
- Calculates deviations between an indicator source and moving averages of variable lengths.
- Moving average lengths are dynamically adjusted using a starting factor and increment factor.
- Deviations are normalized and analyzed to produce median and standard deviation values, forming the FlexiMA oscillator.
Length indicator (50)
🔶FlexiST Component:
- Uses SuperTrend indicators with varying ATR (Average True Range) lengths.
- Trends are identified based on the position of the indicator source relative to the SuperTrend bands.
- Deviations between the indicator source and SuperTrend values are calculated and normalized.
Starting Factor (5)
🔶Combined Strategy Logic:
- Entry Signals:
- Long Entry: Triggered when median values of both FlexiMA and FlexiST are positive.
- Short Entry: Triggered when median values of both FlexiMA and FlexiST are negative.
- Exit Signals:
- Long Exit: Triggered when median values of FlexiMA or FlexiST turn negative.
- Short Exit: Triggered when median values of FlexiMA or FlexiST turn positive.
This strategic blend of FlexiMA and FlexiST allows for a nuanced analysis of market trends, providing traders with signals based on a comprehensive view of market momentum and trend strength.
█ Trade Direction
The strategy is designed to cater to various trading preferences, offering "Long", "Short", and "Both" options. This flexibility allows traders to align the strategy with their specific market outlook, be it bullish, bearish, or a combination of both.
█ Usage
Traders can effectively utilize the FlexiMA x FlexiST Strategy by first selecting their desired trade direction. The strategy then generates entry signals when the conditions for either the FlexiMA or FlexiST are met, indicating potential entry points in the market. Conversely, exit signals are generated when the conditions for these indicators diverge, thus signaling a potential shift in market trends and suggesting a strategic exit point.
█ Default Settings
1. Indicator Source (HLC3): Provides a balanced and stable price source, reducing the impact of extreme market fluctuations.
2. Indicator Lengths (20 for FlexiMA, 10 for FlexiST): Longer FlexiMA length smooths out short-term fluctuations, while shorter FlexiST length allows for quicker response to market changes.
3. Starting Factors (1.0 for FlexiMA, 0.618 for FlexiST): Balanced start for FlexiMA and a harmonized approach for FlexiST, resonating with natural market cycles.
4. Increment Factors (1.0 for FlexiMA, 0.382 for FlexiST): FlexiMA captures a wide range of market behaviors, while FlexiST provides a gradual transition to capture finer trend shifts.
5. Normalization Methods ('None'): Uses raw deviations, suitable for markets where absolute price movements are more significant.
6. Trade Direction ('Both'): Allows strategy to consider both long and short opportunities, ideal for versatile market engagement.
*More details:
1. FlexiMA
2. FlexiST

3kilos BTC 15mThe "3kilos BTC 15m" is a comprehensive trading strategy designed to work on a 15-minute timeframe for Bitcoin (BTC) or other cryptocurrencies. This strategy combines multiple indicators, including Triple Exponential Moving Averages (TEMA), Average True Range (ATR), and Heikin-Ashi candlesticks, to generate buy and sell signals. It also incorporates risk management features like take profit and stop loss.
Indicators
Triple Exponential Moving Averages (TEMA): Three TEMA lines are used with different lengths and sources:
Short TEMA (Red) based on highs
Long TEMA 1 (Blue) based on lows
Long TEMA 2 (Green) based on closing prices
Average True Range (ATR): Custom ATR calculation with EMA smoothing is used for volatility measurement.
Supertrend: Calculated using ATR and a multiplier to determine the trend direction.
Simple Moving Average (SMA): Applied to the short TEMA to smooth out its values.
Heikin-Ashi Close: Used for additional trend confirmation.
Entry & Exit Conditions
Long Entry: Triggered when the short TEMA is above both long TEMA lines, the Supertrend is bullish, the short TEMA is above its SMA, and the Heikin-Ashi close is higher than the previous close.
Short Entry: Triggered when the short TEMA is below both long TEMA lines, the Supertrend is bearish, the short TEMA is below its SMA, and the Heikin-Ashi close is lower than the previous close.
Take Profit and Stop Loss: Both are calculated as a percentage of the entry price, and they are set for both long and short positions.
Risk Management
Take Profit: Set at 1% above the entry price for long positions and 1% below for short positions.
Stop Loss: Set at 3% below the entry price for long positions and 3% above for short positions.
Commission and Pyramiding
Commission: A 0.07% commission is accounted for in the strategy.
Pyramiding: The strategy does not allow pyramiding.
Note
This strategy is designed for educational purposes and should not be considered as financial advice. Always do your own research and consider consulting a financial advisor before engaging in trading.

Dual-Supertrend with MACD - Strategy [presentTrading]## Introduction and How it is Different
The Dual-Supertrend with MACD strategy offers an amalgamation of two trend-following indicators (Supertrend 1 & 2) with a momentum oscillator (MACD). It aims to provide a cohesive and systematic approach to trading, eliminating the need for discretionary decision-making.
Key advantages over traditional single-indicator strategies:
- Dual Supertrend Validation: Utilizes two Supertrend indicators with different ATR periods and factors to confirm the trend direction. This double-check mechanism minimizes false signals.
- Momentum Confirmation: The MACD histogram acts as a momentum filter, confirming entries and exits, thus adding an extra layer of validation.
- Objective Entry and Exit: The strategy generates buy and sell signals based on a combination of trend direction and momentum, leaving no room for subjective interpretation.
- Automated Trade Management: The strategy includes built-in settings for commission, slippage, and initial capital, automating the trade execution process.
- Adaptability: The strategy allows for easy customization of all its parameters, adapting to a trader's specific needs and varying market conditions.
BTCUSD 8hr chart Long Condition
BTCUSD 6hr chart Long Short Condition
## Strategy, How it Works
The strategy operates on a set of clearly defined rules, primarily focusing on the trend direction confirmed by the Dual-Supertrend and the momentum as indicated by the MACD histogram.
### Entry Rules
- Long Entry: When both Supertrend indicators are bullish and the MACD histogram is above zero.
- Short Entry: When both Supertrend indicators are bearish and the MACD histogram is below zero.
### Exit Rules
- Exit long positions when either of the Supertrends turn bearish or the MACD histogram drops below zero.
- Exit short positions when either of the Supertrends turn bullish or the MACD histogram rises above zero.
### Trade Management
- The strategy uses a fixed commission rate and slippage in its calculations.
- Automated risk management features are integrated to avoid overexposure.
## Trade Direction
The strategy allows for trading in both bullish and bearish markets. Users can select their preferred trading direction ("long", "short", or "both") to align with their market outlook and trading objectives.
## Usage
- The strategy is best applied on timeframes where the trend is evident.
- Users can modify the ATR periods, factors for Supertrends, and MACD settings to suit their trading needs.
## Default Settings
- ATR Period for Supertrend 1: 10
- Factor for Supertrend 1: 3.0
- ATR Period for Supertrend 2: 20
- Factor for Supertrend 2: 5.0
- MACD Fast Length: 12
- MACD Slow Length: 26
- MACD Signal Smoothing: 9
- Commission: 0.1%
- Slippage: 1 point
- Trading Direction: Both
The strategy comes with these default settings to offer a balanced trading approach but can be customized according to individual trading preferences.

Limit Order + ATR Stop-Loss [TANHEF]This indicator enables interactive placement of limit or stop-limit orders with a trailing ATR stop-loss and optional profit target (with alerts). Refer to the images below for further clarification.
Why use a trailing stop-loss?
A trailing stop-loss serves as an exit strategy when price moves against you, while also allowing you to adjust the exit point further into profit when price moves favorably. The ATR (Average True Range), a reliable measure of volatility, acts as an effective risk management tool, functioning as a trailing stop-loss.
Indicator Explanation
Initial indicator placement: Select Long Limit or Long-Stop Limit order.
Change Entry Type: Switch between Long and Short within settings.
Modify entry price: Drag circle, adjust in settings, or re-add indicator to chart.
Optional Profit Target: Use Risk/Reward ratio or specify price.
Entry anticipation: Estimated ATR stop-loss and profit target as blue circles (fluctuates with volatility changes).
Entry triggered: Actual ATR stop-loss and profit target plotted.
Exit conditions: Stop-loss or profit target hit, exit entry.
Update Frequency: Continuously, Bar Open, or Bar Open on entry then continuously.
ATR Overlap: no entry occurs if the ATR overlaps with price (stop-loss 'hit' already on entry bar)
Table: Displays input settings selected.
Show Only On Ticker: Ability to hide indicator on other tickers.
Long Limit
Long Stop-Limit
Short Limit
Short Stop-Limit
Alerts
1. 'Check' alerts to use within indicator settings (entry, trailing stop hit, profit target hit, and failed entry).
2. Select 'Create Alert'
3. Set the condition to 'Limit Order + ATR Stop-Loss''
4. Select create.
Additional details can be added to the alert message using these words in between Curly (Brace) Brackets:
{{trail}} = ATR trailing stop-loss (price)
{{target}} = Price target (price)
{{type}} = Long or Short stop-loss (word)
{{traildistance}} = Trailing Distance (%)
{{targetdistance}} = Target Distance (%)
{{starttime}} = Start time of position (day:hr:min)
{{maxdrawdown}} = max loss
{{maxprofit}} = max profit
{{update}} = stoploss update frequency
{{entrysource}} = entry as 1st bar source (yes/no)
{{triggerentry}} = Wick/Close Trigger entry input
{{triggerexit}} = Wick/Close Trigger exit input
{{triggertarget}} = Wick/Close Trigger target input
{{atrlength}} = ATR length input
{{atrmultiplier}} = ATR multiplier input
{{atrtype}} = ATR type input
{{ticker}} = Ticker of chart (word)
{{exchange}} = Exchange of chart (word)
{{description}} = Description of ticker (words)
{{close}} = Bar close (price)
{{open}} = Bar open (price)
{{high}} = Bar high (price)
{{low}} = Bar low (price)
{{hl2}} = Bar HL2 (price)
{{volume}} = Bar volume (value)
{{time}} = Current time (day:hr:min)
{{interval}} = Chart timeframe
{{newline}} = New line for text

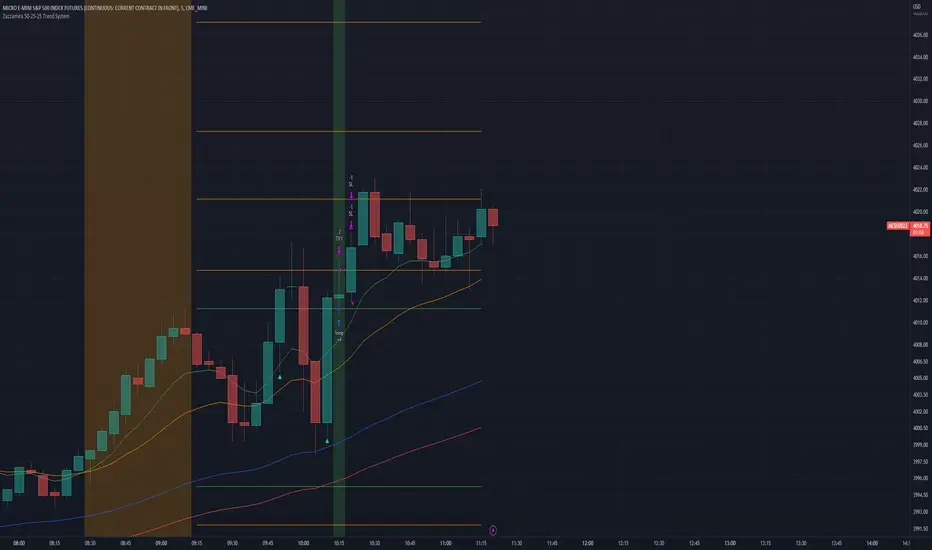
Zazzamira 50-25-25 Trend System Alerts OnlyPublishing my trading system script. It consist of several conditions to happen in order to open a trade. Work best on ES/MES 5 minute timeframe.
I like to use it with this settings:
- UTC -6 (don't tick Exchange Timezone)
and rest as default
To enter a trade, the following conditions must be met: Entry 1: the opening range (8:30AM - 9:15AM UTC-6) must be defined and the price must close above or below the opening range on the 5-minute timeframe. This entry condition defines the trade direction (above = long / below = short). Once the opening range is defined, the Trend-Based Fib Extension is applied from the range high to the range low (and vice versa). Fib levels are required for Exit conditions. Entry 2: the 8 - 27 - 67 - 97 EMAs must be defined. If the EMAs value order is 8 > 27 > 67 > 97, long-only trades are allowed. If the EMAs value order is 8 < 27 < 67 < 97, short-only trades are allowed. This entry condition filters fake breakouts of Entry 1. Entry 3: no trades are allowed after 12:59 UTC-6 (2PM EST). Entry 4: if Entry 1, Entry 2, and Entry 3 conditions are valid and the price hasn't reached the 23.6% Fib line, an entry order can be set at the range high/long with 4 contracts. To exit a trade, the following conditions must be met: Exit 1 (Stop loss): set a trailing stop based on 2.1x ATR (14) from entry. Exit 2: take 50% profits at the 23.6% Fib and leave trailing stop untouched. Exit 3: if Exit 2 triggers, take 50% (25% of total entry) off at 61.8% Fib, leaving Exit 2 trailing stop values valid. Exit 4: exit the full position at the FIB 100% value. Exit 5: all trades must be closed at 3pm UTC-6 (4PM EST). So basically Take Profit are 50%-25%-25% of position.
Code has been written by © Hiubris_Indicators who has been an amazing coder and gave me the possibility to make this script public so a really big shoutout to him.
This indicator only works for alerts, please check version without alerts to backtest or tweaks. This indicator is meant to be used to automate the system via webhooks

Zazzamira 50-25-25 Trend SystemPublishing my trading system script. It consist of several conditions to happen in order to open a trade. Work best on ES/MES 5 minute timeframe.
I like to use it with this settings:
- UTC -6 (don't tick Exchange Timezone)
and rest as default
To enter a trade, the following conditions must be met: Entry 1: the opening range (8:30AM - 9:15AM UTC-6) must be defined and the price must close above or below the opening range on the 5-minute timeframe. This entry condition defines the trade direction (above = long / below = short). Once the opening range is defined, the Trend-Based Fib Extension is applied from the range high to the range low (and vice versa). Fib levels are required for Exit conditions. Entry 2: the 8 - 27 - 67 - 97 EMAs must be defined. If the EMAs value order is 8 > 27 > 67 > 97, long-only trades are allowed. If the EMAs value order is 8 < 27 < 67 < 97, short-only trades are allowed. This entry condition filters fake breakouts of Entry 1. Entry 3: no trades are allowed after 12:59 UTC-6 (2PM EST). Entry 4: if Entry 1, Entry 2, and Entry 3 conditions are valid and the price hasn't reached the 23.6% Fib line, an entry order can be set at the range high/long with 4 contracts. To exit a trade, the following conditions must be met: Exit 1 (Stop loss): set a trailing stop based on 2.1x ATR (14) from entry. Exit 2: take 50% profits at the 23.6% Fib and leave trailing stop untouched. Exit 3: if Exit 2 triggers, take 50% (25% of total entry) off at 61.8% Fib, leaving Exit 2 trailing stop values valid. Exit 4: exit the full position at the FIB 100% value. Exit 5: all trades must be closed at 3pm UTC-6 (4PM EST). So basically Take Profit are 50%-25%-25% of position.
Code has been written by © Hiubris_Indicators who has been an amazing coder and gave me the possibility to make this script public so a really big shoutout to him.
Coral Trend Pullback Strategy (TradeIQ)Description:
Strategy is taken from the TradeIQ YouTube video called "I Finally Found 80% Win Rate Trading Strategy For Crypto".
Check out the full video for further details/clarification on strategy entry/exit conditions.
The default settings are exactly as TradeIQ described in his video.
However I found some better results by some tweaking settings, increasing R:R ratio and by turning off confirmation indicators.
This would suggest that perhaps the current confirmation indicators are not the best options. I'm happy to try add some other optional confirmation indicators if they look to be more effective.
Recommended timeframe: 1H
Strategy incorporates the following features:
Risk management:
Configurable X% loss per stop loss
Configurable R:R ratio
Trade entry:
Based on strategy conditions below
Trade exit:
Based on strategy conditions below
Backtesting:
Configurable backtesting range by date
Trade drawings:
Each entry condition indicator can be turned on and off
TP/SL boxes drawn for all trades. Can be turned on and off
Trade exit information labels. Can be turned on and off
NOTE: Trade drawings will only be applicable when using overlay strategies
Alerting:
Alerts on LONG and SHORT trade entries
Debugging:
Includes section with useful debugging techniques
Strategy conditions
Trade entry:
LONG
C1: Coral Trend is bullish
C2: At least 1 candle where low is above Coral Trend since last cross above Coral Trend
C3: Pullback happens and price closes below Coral Trend
C4: Coral Trend colour remains bullish for duration of pullback
C5: After valid pullback, price then closes above Coral Trend
C6: Optional confirmation indicators (choose either C6.1 or C6.2 or NONE):
C6.1: ADX and DI (Single indicator)
C6.1.1: Green line is above red line
C6.1.2: Blue line > 20
C6.1.3: Blue trending up over last 1 candle
C6.2: Absolute Strengeh Histogram + HawkEye Volume Indicator (Two indicators combined)
C6.2.1: Absolute Strengeh Histogram colour is blue
C6.2.2: HawkEye Volume Indicator colour is green
SHORT
C1: Coral Trend is bearish
C2: At least 1 candle where high is below Coral Trend since last cross below Coral Trend
C3: Pullback happens and price closes above Coral Trend
C4: Coral Trend colour remains bearish for duration of pullback
C5: After valid pullback, price then closes below Coral Trend
C6: Optional confirmation indicators (choose either C6.1 or C6.2 or NONE):
C6.1: ADX and DI (Single indicator)
C6.1.1: Red line is above green line
C6.1.2: Blue line > 20
C6.1.3: Blue trending up over last 1 candle
C6.2: Absolute Strengeh Histogram + HawkEye Volume Indicator (Two indicators combined)
C6.2.1: Absolute Strengeh Histogram colour is red
C6.2.2: HawkEye Volume Indicator colour is red
NOTE: All the optional confirmation indicators cannot be overlayed with Coral Trend so feel free to add each separately to the chart for visual purposes
Trade exit:
Stop Loss: Calculated by recent swing low over previous X candles (configurable with "Local High/Low Lookback")
Take Profit: Calculated from R:R multiplier * Stop Loss size
Credits
Strategy origin: TradeIQ's YouTube video called "I Finally Found 80% Win Rate Trading Strategy For Crypto"
It combines the following indicators for trade entry conditions:
Coral Trend Indicator by @LazyBear (Main indicator)
Absolute Strength Histogram | jh by @jiehonglim (Optional confirmation indicator)
Indicator: HawkEye Volume Indicator by @LazyBear (Optional confirmation indicator)
ADX and DI by @BeikabuOyaji (Optional confirmation indicator)

DMI StrategyThis strategy is based on DMI indicator. It helps me to identify base or top of the script. I mostly use this script to trade in Nifty bank options, even when the signal comes in nifty . It can be used to trade in other scripts as well. Pivot points can also be used to take entry. Long entry is taken when DI+(11) goes below 10 and DI-(11) goes above 40 , whereas short entry is taken when DI-(11) goes below 10 and DI+(11) goes above 40.
For bank nifty , I take the trade in the strike price for which the current premium is nearby 300, with the SL of 20%. If premium goes below 10% I buy one more lot to average, but exit if the premium goes below 20% of the first entry. If the trade moves in the correct direction, we need to start trailing our stoploss or exit at the pre-defined target.
As this a strategy, there is one problem. While we are in the phase of "long", if again the "long" phase comes, it will not be shown on chart until a "short" phase has come, and vice versa. This has been resolved by creating an indicator instead of strategy with the name of "DMI Buy-sell on chart". Please go through that to get more entry points.
Please have a look at strategy tester to back test

DMI StrategyThis strategy is based on DMI indicator. It helps me to identify base or top of the script. I mostly use this script to trade in Nifty bank options, even when the signal comes in nifty. It can be used to trade in other scripts as well. Pivot points can also be used to take entry. Long entry is taken when DI+(11) goes below 10 and DI-(11) goes above 40, whereas short entry is taken when DI-(11) goes below 10 and DI+(11) goes above 40.
For bank nifty, I take the trade in the strike price for which the current premium is nearby 300, with the SL of 20%. If premium goes below 10% I buy one more lot to average, but exit if the premium goes below 20% of the first entry. If the trade moves in the correct direction, we need to start trailing our stoploss or exit at the pre-defined target.
Please have a look at strategy tester to back test.
