Weighted Regression Bands (Zeiierman)█ Overview
Weighted Regression Bands is a precision-engineered trend and volatility tool designed to adapt to the real market structure instead of reacting to price noise.
This indicator analyzes Weighted High/Low medians and applies user-selectable smoothing methods — including Kalman Filtering, ALMA, and custom Linear Regression — to generate a Fair Value line. Around this, it constructs dynamic standard deviation bands that adapt in real-time to market volatility.
The result is a visually clean and structurally intelligent trend framework suitable for breakout traders, mean reversion strategies, and trend-driven analysis.
█ How It Works
⚪ Structural High/Low Analysis
At the heart of this indicator is a custom high/low weighting system. Instead of using just the raw high or low values, it calculates a midline = (high + low) / 2, then applies one of three weighting methods to determine which price zones matter most.
Users can select the method using the “Weighted HL Method” setting:
Simple
Selects the single most dominant median (highest or lowest) in the lookback window. Ideal for fast, reactive signals.
Advanced
Ranks each bar based on a composite score: median × range × recency. This method highlights structurally meaningful bars that had both volatility and recency. A built-in Kalman filter is applied for extra stability.
Smooth
Blends multiple bars into a single weighted average using smoothed decay and range. This provides the softest and most stable structural response.
⚪ Smoothing Methods (ALMA / Linear Regression)
ALMA provides responsive, low-lag smoothing for fast trend reading.
Linear Regression projects the Fair Value forward, ideal for trend modeling.
⚪ Kalman Smoothing Filter
Before trend calculations, the indicator applies an optional Kalman-style smoothing filter. This helps:
Reduce choppy false shifts in trend,
Retain signal clarity during volatile periods,
Provide stability for long-term setups.
⚪ Deviation Bands (Dynamic Volatility Envelopes)
The indicator builds ±1, ±2, and ±3 standard deviation bands around the fair value line:
Calculated from the standard deviation of price,
Bands expand and contract based on recent volatility,
Visualizes potential overbought/oversold or trending conditions.
█ How to Use
⚪ Trend Trading & Filtering
Use the Fair Value line to identify the dominant direction.
Only trade in the direction of the slope for higher probability setups.
⚪ Volatility-Based Entries
Watch for price reaching outer bands (+2σ, +3σ) for possible exhaustion.
Mean reversion entries become higher quality when far from Fair Value.
█ Settings
Length – Lookback for Weighted HL and trend smoothing
Deviation Multiplier – Controls how wide the bands are from the fair value line
Method – Choose between ALMA or Linear Regression smoothing
Smoothing – Strength of Kalman Filter (1 = none, <1 = stronger smoothing)
-----------------
Disclaimer
The content provided in my scripts, indicators, ideas, algorithms, and systems is for educational and informational purposes only. It does not constitute financial advice, investment recommendations, or a solicitation to buy or sell any financial instruments. I will not accept liability for any loss or damage, including without limitation any loss of profit, which may arise directly or indirectly from the use of or reliance on such information.
All investments involve risk, and the past performance of a security, industry, sector, market, financial product, trading strategy, backtest, or individual's trading does not guarantee future results or returns. Investors are fully responsible for any investment decisions they make. Such decisions should be based solely on an evaluation of their financial circumstances, investment objectives, risk tolerance, and liquidity needs.
Trendband

Quantitative Breakout Bands (AIBitcoinTrend)Quantitative Breakout Bands (AIBitcoinTrend) is an advanced indicator designed to adapt to dynamic market conditions by utilizing a Kalman filter for real-time data analysis and trend detection. This innovative tool empowers traders to identify price breakouts, evaluate trends, and refine their trading strategies with precision.
👽 What Are Quantitative Breakout Bands, and Why Are They Unique?
Quantitative Breakout Bands combine advanced filtering techniques (Kalman Filters) with statistical measures such as mean absolute error (MAE) to create adaptive price bands. These bands adjust to market conditions dynamically, providing insights into volatility, trend strength, and breakout opportunities.
What sets this indicator apart is its ability to incorporate both position (price) and velocity (rate of price change) into its calculations, making it highly responsive yet smooth. This dual consideration ensures traders get reliable signals without excessive lag or noise.
👽 The Math Behind the Indicator
👾 Kalman Filter Estimation:
At the core of the indicator is the Kalman Filter, a recursive algorithm used to predict the next state of a system based on past observations. It incorporates two primary elements:
State Prediction: The indicator predicts future price (position) and velocity based on previous values.
Error Covariance Adjustment: The process and measurement noise parameters refine the prediction's accuracy by balancing smoothness and responsiveness.
👾 Breakout Bands Calculation:
The breakout bands are derived from the mean absolute error (MAE) of price deviations relative to the filtered trendline:
float upperBand = kalmanPrice + bandMultiplier * mae
float lowerBand = kalmanPrice - bandMultiplier * mae
The multiplier allows traders to adjust the sensitivity of the bands to market volatility.
👾 Slope-Based Trend Detection:
A weighted slope calculation measures the gradient of the filtered price over a configurable window. This slope determines whether the market is trending bullish, bearish, or neutral.
👾 Trailing Stop Mechanism:
The trailing stop employs the Average True Range (ATR) to calculate dynamic stop levels. This ensures positions are protected during volatile moves while minimizing premature exits.
👽 How It Adapts to Price Movements
Dynamic Noise Calibration: By adjusting process and measurement noise inputs, the indicator balances smoothness (to reduce noise) with responsiveness (to adapt to sharp price changes).
Trend Responsiveness: The Kalman Filter ensures that trend changes are quickly identified, while the slope calculation adds confirmation.
Volatility Sensitivity: The MAE-based bands expand and contract in response to changes in market volatility, making them ideal for breakout detection.
👽 How Traders Can Use the Indicator
👾 Breakout Detection:
Bullish Breakouts: When the price moves above the upper band, it signals a potential upward breakout.
Bearish Breakouts: When the price moves below the lower band, it signals a potential downward breakout.
The trailing stop feature offers a dynamic way to lock in profits or minimize losses during trending moves.
👾 Trend Confirmation:
The color-coded Kalman line and slope provide visual cues:
Bullish Trend: Positive slope, green line.
Bearish Trend: Negative slope, red line.
👽 Why It’s Useful for Traders
Dynamic and Adaptive: The indicator adjusts to changing market conditions, ensuring relevance across timeframes and asset classes.
Noise Reduction: The Kalman Filter smooths price data, eliminating false signals caused by short-term noise.
Comprehensive Insights: By combining breakout detection, trend analysis, and risk management, it offers a holistic trading tool.
👽 Indicator Settings
Process Noise (Position & Velocity): Adjusts filter responsiveness to price changes.
Measurement Noise: Defines expected price noise for smoother trend detection.
Slope Window: Configures the lookback for slope calculation.
Lookback Period for MAE: Defines the sensitivity of the bands to volatility.
Band Multiplier: Controls the band width.
ATR Multiplier: Adjusts the sensitivity of the trailing stop.
Line Width: Customizes the appearance of the trailing stop line.
Disclaimer: This indicator is designed for educational purposes and does not constitute financial advice. Please consult a qualified financial advisor before making investment decisions.

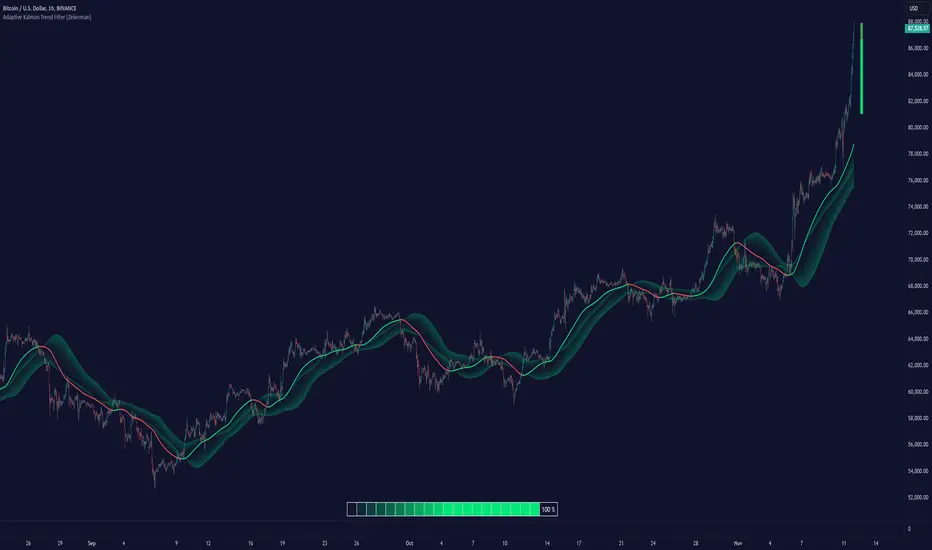
Adaptive Kalman Trend Filter (Zeiierman)█ Overview
The Adaptive Kalman Trend Filter indicator is an advanced trend-following tool designed to help traders accurately identify market trends. Utilizing the Kalman Filter—a statistical algorithm rooted in control theory and signal processing—this indicator adapts to changing market conditions, smoothing price data to filter out noise. By focusing on state vector-based calculations, it dynamically adjusts trend and range measurements, making it an excellent tool for both trend-following and range-based trading strategies. The indicator's adaptive nature is enhanced by options for volatility adjustment and three unique Kalman filter models, each tailored for different market conditions.
█ How It Works
The Kalman Filter works by maintaining a model of the market state through matrices that represent state variables, error covariances, and measurement uncertainties. Here’s how each component plays a role in calculating the indicator’s trend:
⚪ State Vector (X): The state vector is a two-dimensional array where each element represents a market property. The first element is an estimate of the true price, while the second element represents the rate of change or trend in that price. This vector is updated iteratively with each new price, maintaining an ongoing estimate of both price and trend direction.
⚪ Covariance Matrix (P): The covariance matrix represents the uncertainty in the state vector’s estimates. It continuously adapts to changing conditions, representing how much error we expect in our trend and price estimates. Lower covariance values suggest higher confidence in the estimates, while higher values indicate less certainty, often due to market volatility.
⚪ Process Noise (Q): The process noise matrix (Q) is used to account for uncertainties in price movements that aren’t explained by historical trends. By allowing some degree of randomness, it enables the Kalman Filter to remain responsive to new data without overreacting to minor fluctuations. This noise is particularly useful in smoothing out price movements in highly volatile markets.
⚪ Measurement Noise (R): Measurement noise is an external input representing the reliability of each new price observation. In this indicator, it is represented by the setting Measurement Noise and determines how much weight is given to each new price point. Higher measurement noise makes the indicator less reactive to recent prices, smoothing the trend further.
⚪ Update Equations:
Prediction: The state vector and covariance matrix are first projected forward using a state transition matrix (F), which includes market estimates based on past data. This gives a “predicted” state before the next actual price is known.
Kalman Gain Calculation: The Kalman gain is calculated by comparing the predicted state with the actual price, balancing between the covariance matrix and measurement noise. This gain determines how much of the observed price should influence the state vector.
Correction: The observed price is then compared to the predicted price, and the state vector is updated using this Kalman gain. The updated covariance matrix reflects any adjustment in uncertainty based on the latest data.
█ Three Kalman Filter Models
Standard Model: Assumes that market fluctuations follow a linear progression without external adjustments. It is best suited for stable markets.
Volume Adjusted Model: Adjusts the filter sensitivity based on trading volume. High-volume periods result in stronger trends, making this model suitable for volume-driven assets.
Parkinson Adjusted Model: Uses the Parkinson estimator, accounting for volatility through high-low price ranges, making it effective in markets with high intraday fluctuations.
These models enable traders to choose a filter that aligns with current market conditions, enhancing trend accuracy and responsiveness.
█ Trend Strength
The Trend Strength provides a visual representation of the current trend's strength as a percentage based on oscillator calculations from the Kalman filter. This table divides trend strength into color-coded segments, helping traders quickly assess whether the market is strongly trending or nearing a reversal point. A high trend strength percentage indicates a robust trend, while a low percentage suggests weakening momentum or consolidation.
█ Trend Range
The Trend Range section evaluates the market's directional movement over a specified lookback period, highlighting areas where price oscillations indicate a trend. This calculation assesses how prices vary within the range, offering an indication of trend stability or the likelihood of reversals. By adjusting the trend range setting, traders can fine-tune the indicator’s sensitivity to longer or shorter trends.
█ Sigma Bands
The Sigma Bands in the indicator are based on statistical standard deviations (sigma levels), which act as dynamic support and resistance zones. These bands are calculated using the Kalman Filter's trend estimates and adjusted for volatility (if enabled). The bands expand and contract according to market volatility, providing a unique visualization of price boundaries. In high-volatility periods, the bands widen, offering better protection against false breakouts. During low volatility, the bands narrow, closely tracking price movements. Traders can use these sigma bands to spot potential entry and exit points, aiming for reversion trades or trend continuation setups.
Trend Based
Volatility Based
█ How to Use
Trend Following:
When the Kalman Filter is green, it signals a bullish trend, and when it’s red, it indicates a bearish trend. The Sigma Cloud provides additional insights into trend strength. In a strong bullish trend, the cloud remains below the Kalman Filter line, while in a strong bearish trend, the cloud stays above it. Expansion and contraction of the Sigma Cloud indicate market momentum changes. Rapid expansion suggests an impulsive move, which could either signal the continuation of the trend or be an early sign of a possible trend reversal.
Mean Reversion: Watch for prices touching the upper or lower sigma bands, which often act as dynamic support and resistance.
Volatility Breakouts: Enable volatility-adjusted sigma bands. During high volatility, watch for price movements that extend beyond the bands as potential breakout signals.
Trend Continuation: When the Kalman Filter line aligns with a high trend strength, it signals a continuation in that direction.
█ Settings
Measurement Noise: Adjusts how sensitive the indicator is to price changes. Higher values smooth out fluctuations but delay reaction, while lower values increase sensitivity to short-term changes.
Kalman Filter Model: Choose between the standard, volume-adjusted, and Parkinson-adjusted models based on market conditions.
Band Sigma: Sets the standard deviation used for calculating the sigma bands, directly affecting the width of the dynamic support and resistance.
Volatility Adjusted Bands: Enables bands to dynamically adapt to volatility, increasing their effectiveness in fluctuating markets.
Trend Strength: Defines the lookback period for trend strength calculation. Shorter periods result in more responsive trend strength readings, while longer periods smooth out the calculation.
Trend Range: Specifies the lookback period for the trend range, affecting the assessment of trend stability over time.
-----------------
Disclaimer
The information contained in my Scripts/Indicators/Ideas/Algos/Systems does not constitute financial advice or a solicitation to buy or sell any securities of any type. I will not accept liability for any loss or damage, including without limitation any loss of profit, which may arise directly or indirectly from the use of or reliance on such information.
All investments involve risk, and the past performance of a security, industry, sector, market, financial product, trading strategy, backtest, or individual's trading does not guarantee future results or returns. Investors are fully responsible for any investment decisions they make. Such decisions should be based solely on an evaluation of their financial circumstances, investment objectives, risk tolerance, and liquidity needs.
My Scripts/Indicators/Ideas/Algos/Systems are only for educational purposes!