## Japanese Yen Futures Short - Technical Narrative 📊
### The Elliott Wave Story (1→5)
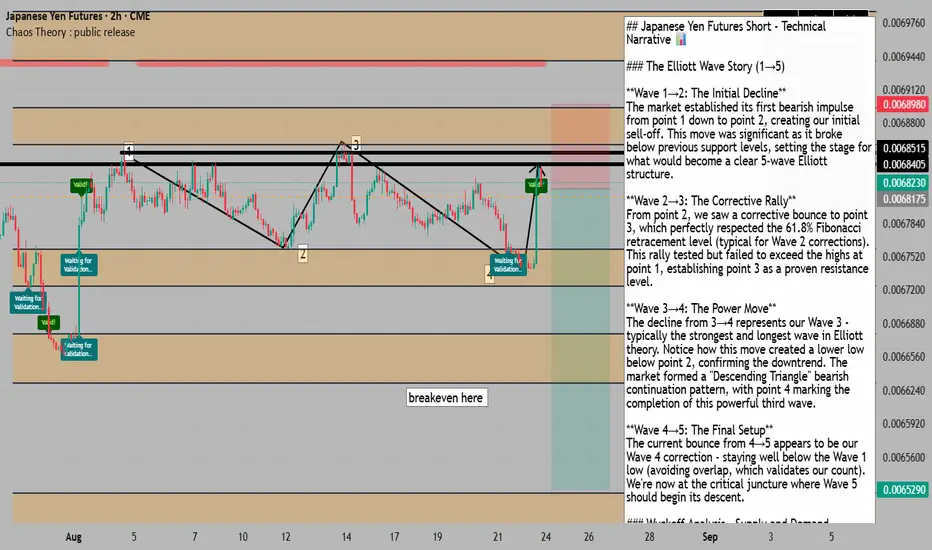
**Wave 1→2: The Initial Decline**
The market established its first bearish impulse from point 1 down to point 2, creating our initial sell-off. This move was significant as it broke below previous support levels, setting the stage for what would become a clear 5-wave Elliott structure.
**Wave 2→3: The Corrective Rally**
From point 2, we saw a corrective bounce to point 3, which perfectly respected the 61.8% Fibonacci retracement level (typical for Wave 2 corrections). This rally tested but failed to exceed the highs at point 1, establishing point 3 as a proven resistance level.
**Wave 3→4: The Power Move**
The decline from 3→4 represents our Wave 3 - typically the strongest and longest wave in Elliott theory. Notice how this move created a lower low below point 2, confirming the downtrend. The market formed a "Descending Triangle" bearish continuation pattern, with point 4 marking the completion of this powerful third wave.
**Wave 4→5: The Final Setup**
The current bounce from 4→5 appears to be our Wave 4 correction - staying well below the Wave 1 low (avoiding overlap, which validates our count). We're now at the critical juncture where Wave 5 should begin its descent.
### Wyckoff Analysis - Supply and Demand Dynamics
Points 1 and 3 represent **proven sellers** - they've demonstrated their strength by pushing price below the uptrend support from point 2. The move from 4→5 represents a "return to supply" - weak buyers attempting to rally but meeting the dominant sellers who control this market. This is textbook Wyckoff distribution.
### The Chaos Zone Confluence 🎯
Your orange zones align perfectly with our analysis:
- Upper zone rejection at current levels (0.00682)
- "Breakeven here" notation at 0.006625 provides our first target
- Lower zone at 0.006529 offers our extended target
With chaos theory zones showing a 63% breakdown success rate over 2,500 candles, the probability favors continuation lower.
### Technical Divergences & Patterns
You've correctly identified:
- **Bearish divergence** on MFI and RSI
- **Sharp triangle turn** pattern suggesting reversal
- **Lower low confirmation** on the recent 2H candle close
### Fundamental Catalysts 🌍
The technical setup gains massive conviction from:
- Record net-long positioning in Yen futures (298k contracts) - extreme sentiment ready to unwind
- BOJ maintaining dovish stance at 0.50% while markets positioned for hawkish surprises
- Daily chart showing multiple rejections at 0.0068260 resistance level
### The Trade Setup 🎯
**ENTRY**: Market entry at 0.006822
**STOP LOSS OPTIONS**:
1. **Conservative**: Above points 1 & 3 at 0.006855 (33 pips risk)
2. **Aggressive**: Just above point 5 high at 0.006835 (13 pips risk)
**TARGETS**:
- **TP1**: 0.006625 (Chaos zone "breakeven" level) - 197 pips
- **TP2**: 0.006529 (Lower chaos zone) - 293 pips
**Risk/Reward**:
- Conservative stop: 1:6 R/R to TP1, 1:9 R/R to TP2
- Aggressive stop: 1:15 R/R to TP1, 1:22 R/R to TP2
### The Narrative Conclusion 📝
We have a complete Elliott Wave 5-wave structure approaching its final leg down. The Wyckoff distribution shows sellers in control at points 1 and 3, with buyers exhausted at point 4. The current position at point 5 represents the last gasp before the markdown phase.
Combined with:
- Record speculative long positioning ready to liquidate
- BOJ dovishness versus market expectations
- Major daily resistance overhead
- Chaos zones predicting downside with 63% accuracy
- Technical divergences confirming weakness
**This sets up a HIGH-CONVICTION short with exceptional risk/reward.**
The aggressive stop above point 5 (0.006835) makes more sense given the strong resistance and allows for massive R/R. If we're wrong and break above, we want out quickly anyway. The two-zone target strategy lets you take partial profits at the first chaos zone and ride the rest to the lower target.
**The stars have aligned: Elliott Waves + Wyckoff + Chaos Theory + COT Extremes + BOJ Fundamentals = SELL** 🎯
### The Elliott Wave Story (1→5)
**Wave 1→2: The Initial Decline**
The market established its first bearish impulse from point 1 down to point 2, creating our initial sell-off. This move was significant as it broke below previous support levels, setting the stage for what would become a clear 5-wave Elliott structure.
**Wave 2→3: The Corrective Rally**
From point 2, we saw a corrective bounce to point 3, which perfectly respected the 61.8% Fibonacci retracement level (typical for Wave 2 corrections). This rally tested but failed to exceed the highs at point 1, establishing point 3 as a proven resistance level.
**Wave 3→4: The Power Move**
The decline from 3→4 represents our Wave 3 - typically the strongest and longest wave in Elliott theory. Notice how this move created a lower low below point 2, confirming the downtrend. The market formed a "Descending Triangle" bearish continuation pattern, with point 4 marking the completion of this powerful third wave.
**Wave 4→5: The Final Setup**
The current bounce from 4→5 appears to be our Wave 4 correction - staying well below the Wave 1 low (avoiding overlap, which validates our count). We're now at the critical juncture where Wave 5 should begin its descent.
### Wyckoff Analysis - Supply and Demand Dynamics
Points 1 and 3 represent **proven sellers** - they've demonstrated their strength by pushing price below the uptrend support from point 2. The move from 4→5 represents a "return to supply" - weak buyers attempting to rally but meeting the dominant sellers who control this market. This is textbook Wyckoff distribution.
### The Chaos Zone Confluence 🎯
Your orange zones align perfectly with our analysis:
- Upper zone rejection at current levels (0.00682)
- "Breakeven here" notation at 0.006625 provides our first target
- Lower zone at 0.006529 offers our extended target
With chaos theory zones showing a 63% breakdown success rate over 2,500 candles, the probability favors continuation lower.
### Technical Divergences & Patterns
You've correctly identified:
- **Bearish divergence** on MFI and RSI
- **Sharp triangle turn** pattern suggesting reversal
- **Lower low confirmation** on the recent 2H candle close
### Fundamental Catalysts 🌍
The technical setup gains massive conviction from:
- Record net-long positioning in Yen futures (298k contracts) - extreme sentiment ready to unwind
- BOJ maintaining dovish stance at 0.50% while markets positioned for hawkish surprises
- Daily chart showing multiple rejections at 0.0068260 resistance level
### The Trade Setup 🎯
**ENTRY**: Market entry at 0.006822
**STOP LOSS OPTIONS**:
1. **Conservative**: Above points 1 & 3 at 0.006855 (33 pips risk)
2. **Aggressive**: Just above point 5 high at 0.006835 (13 pips risk)
**TARGETS**:
- **TP1**: 0.006625 (Chaos zone "breakeven" level) - 197 pips
- **TP2**: 0.006529 (Lower chaos zone) - 293 pips
**Risk/Reward**:
- Conservative stop: 1:6 R/R to TP1, 1:9 R/R to TP2
- Aggressive stop: 1:15 R/R to TP1, 1:22 R/R to TP2
### The Narrative Conclusion 📝
We have a complete Elliott Wave 5-wave structure approaching its final leg down. The Wyckoff distribution shows sellers in control at points 1 and 3, with buyers exhausted at point 4. The current position at point 5 represents the last gasp before the markdown phase.
Combined with:
- Record speculative long positioning ready to liquidate
- BOJ dovishness versus market expectations
- Major daily resistance overhead
- Chaos zones predicting downside with 63% accuracy
- Technical divergences confirming weakness
**This sets up a HIGH-CONVICTION short with exceptional risk/reward.**
The aggressive stop above point 5 (0.006835) makes more sense given the strong resistance and allows for massive R/R. If we're wrong and break above, we want out quickly anyway. The two-zone target strategy lets you take partial profits at the first chaos zone and ride the rest to the lower target.
**The stars have aligned: Elliott Waves + Wyckoff + Chaos Theory + COT Extremes + BOJ Fundamentals = SELL** 🎯
for trading mentorship and community, message me on telegram : jacesabr_real
Clause de non-responsabilité
Les informations et les publications ne sont pas destinées à être, et ne constituent pas, des conseils ou des recommandations en matière de finance, d'investissement, de trading ou d'autres types de conseils fournis ou approuvés par TradingView. Pour en savoir plus, consultez les Conditions d'utilisation.