يتداول سهم أبل ضمن هيكل فني يُرجّح أحد سيناريوهين رئيسيين:
✅ السيناريو الأول: صعود مؤقت ثم تصحيح
يتوقع أن يصعد السهم على المدى القصير إلى المستويات التالية:
221.92
242.83
263.78
273.00
ثم يبدأ بعدها موجة تصحيح هابطة تستهدف المستويات التالية بالترتيب:
216.00
201.60
200.00
180.00
178.22
153.38
151.43 (منطقة دعم قوية وقد تكون نهاية التصحيح)
✅ السيناريو الثاني: تصحيح أولًا ثم انطلاق صاعد
في حال فشل السهم في الصعود المباشر، قد يهبط أولًا إلى منطقة 151.43 – 153.38، وهي منطقة دعم قوية مرشحة لبداية موجة صعود رئيسية.
🔼 الأهداف الصعودية طويلة الأجل بعد اكتمال التصحيح:
271.00 (نقطة محورية ومفتاح التحول الصعودي)
307.00
345.00
380.00
418.00
✳️ ملاحظات فنية:
السلوك السعري عند 151.43 – 153.38 سيكون حاسمًا لتأكيد الانعكاس الصعودي.
اختراق 271.00 يعتبر إشارة قوية لانطلاق اتجاه صاعد جديد طويل المدى.
📌 تنويه: هذا التحليل فني بحت لأغراض دراسية وتحليلية، ولا يُعتبر توصية بيع أو شراء. القرار الاستثماري مسؤوليتك وحدك.
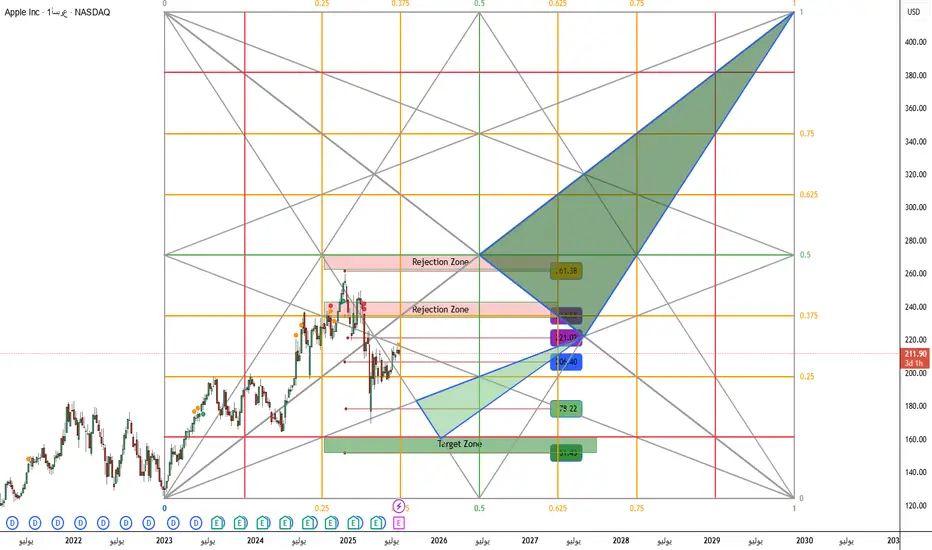
Apple's stock is currently trading within a complex technical structure that favors two primary scenarios:
✅ Scenario 1: Short-term Rally Followed by Correction
In the short term, the stock may rise toward the following resistance levels:
221.92
242.83
263.78
273.00
After this potential rally, a corrective move to the downside is expected, targeting the following support zones in order:
216.00
201.60
200.00
180.00
178.22
153.38
151.43 (key support zone and likely end of the correction)
✅ Scenario 2: Immediate Correction Before the Next Bullish Leg
Alternatively, the price may head directly to the 151.43 – 153.38 support area before starting a new major bullish cycle.
🔼 Long-Term Bullish Targets (after the correction completes):
271.00 (pivot point and breakout confirmation level)
307.00
345.00
380.00
418.00
✳️ Technical Notes:
Price action around 151.43 – 153.38 will be critical in determining whether a strong reversal begins.
A confirmed breakout above 271.00 could mark the beginning of a long-term bullish trend.
📌 Disclaimer: This is a technical analysis provided for educational and analytical purposes only. It does not constitute a buy or sell recommendation. All investment decisions are your sole responsibility.
Clause de non-responsabilité
Les informations et publications ne sont pas destinées à être, et ne constituent pas, des conseils ou recommandations financiers, d'investissement, de trading ou autres fournis ou approuvés par TradingView. Pour en savoir plus, consultez les Conditions d'utilisation.
Clause de non-responsabilité
Les informations et publications ne sont pas destinées à être, et ne constituent pas, des conseils ou recommandations financiers, d'investissement, de trading ou autres fournis ou approuvés par TradingView. Pour en savoir plus, consultez les Conditions d'utilisation.