📈  AAPL Weekly Chart Update
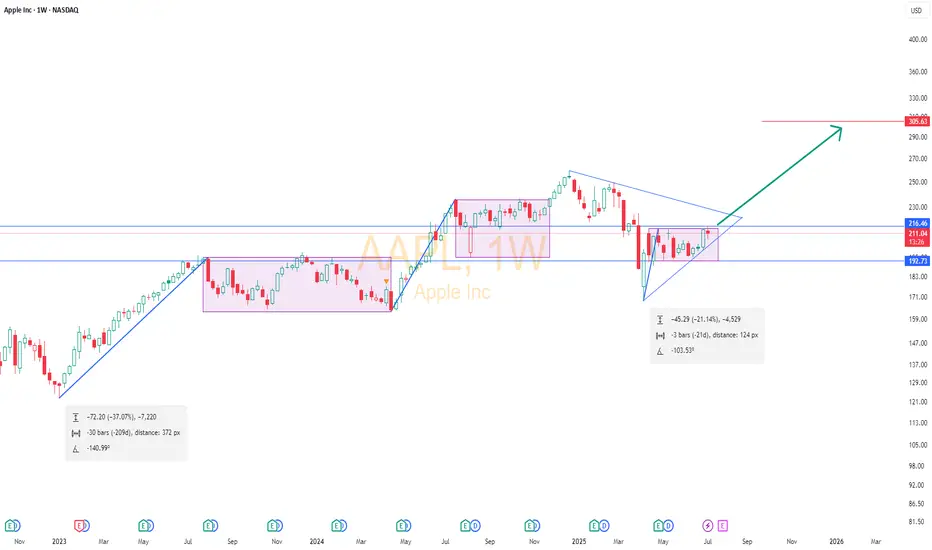
Apple is forming its third bullish flag since Jan 2023.
🔹 Flags:
1️⃣ Jan 2023 – Feb 2024
2️⃣ May 2024 – Mar 2025
3️⃣ Ongoing since Apr 2025
🔺 A triangle formation from Dec 2024 to Apr 2025 low is also converging.
💥 Breakout level: Weekly close above $216
📉 Stop Loss: $193 (weekly close)
🎯 Target: $305 in coming weeks
Technicals point to a strong bullish setup. Keep it on watch!
#AAPL #Apple #StockMarket #ChartAnalysis #TradingView
Clause de non-responsabilité
Les informations et publications ne sont pas destinées à être, et ne constituent pas, des conseils ou recommandations financiers, d'investissement, de trading ou autres fournis ou approuvés par TradingView. Pour en savoir plus, consultez les Conditions d'utilisation.
Clause de non-responsabilité
Les informations et publications ne sont pas destinées à être, et ne constituent pas, des conseils ou recommandations financiers, d'investissement, de trading ou autres fournis ou approuvés par TradingView. Pour en savoir plus, consultez les Conditions d'utilisation.