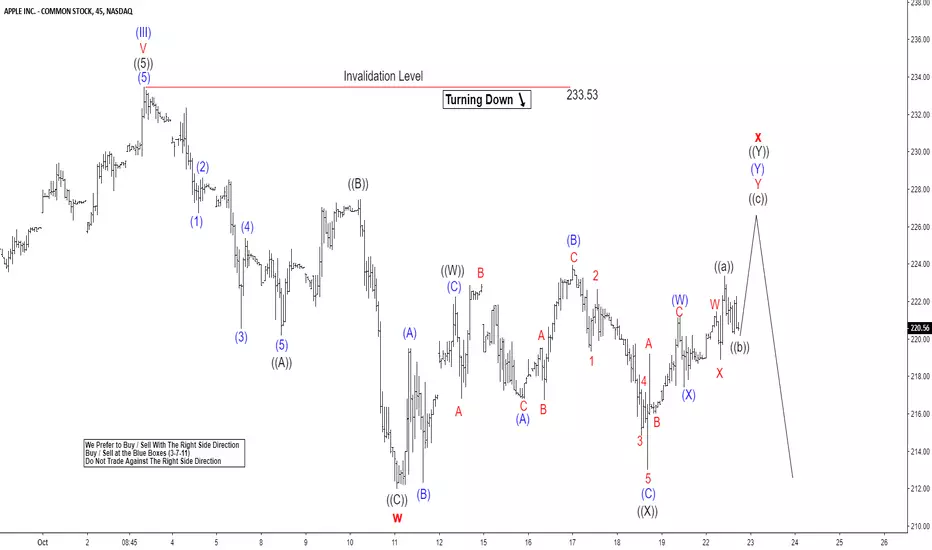
AAPL short-term Elliott wave view suggests that a rally to $233.53 high ended blue wave (III) as an impulse. Down from there, blue wave (IV) remains in progress as double three structure. Where the initial decline to $212 low ended red wave W The internals of that leg lower unfolded as a Zigzag structure where black wave ((A)) ended in 5 waves at $220.20 low. Up from there a bounce to $227.48 high ended black wave ((B)) bounce. Then finally a decline to $212 low ended black wave ((C)) in another 5 waves & also completed cycle red wave W.
Up from there, the stock has been correcting the cycle from $233.53 high in red X bounce. The internals of that bounce in unfolding as Elliott Wave double three structure. Where black wave ((W)) ended at $222.25 high. Then a pullback to $213 low ended black wave ((X)) as a Flat structure. Above from there, it is expected to see more upside in black wave ((Y)).
And while bounce fails below $233.53 high we expect AAPL to extend lower 1 more time before upside renew or stock does a 3 wave bounce at least. We don’t like selling it.
14 days trial --> elliottwave-forecast.com/plan-trial/ and get Accurate & timely Elliott Wave Forecasts of 78 instruments. Webinars, Chat Room, Stocks/Forex/Indices Signals & more.
Clause de non-responsabilité
Les informations et publications ne sont pas destinées à être, et ne constituent pas, des conseils ou recommandations financiers, d'investissement, de trading ou autres fournis ou approuvés par TradingView. Pour en savoir plus, consultez les Conditions d'utilisation.