Apple Inc. (AAPL) 4H – NASDAQ chart:
Here’s a detailed read of the setup my drawn 👇
---
🧭 Chart Overview
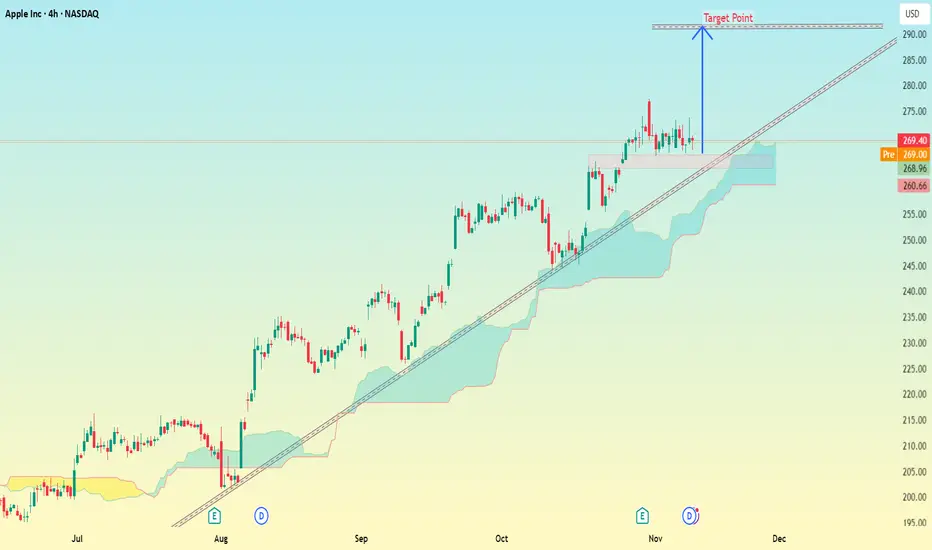
Current Price: ≈ $269.4
Trend: Strong uptrend (price holding above Ichimoku cloud & rising trendline)
Support Zone: Around $265 – $266 (where price retested the trendline + cloud)
Resistance/Target Box: Marked on my chart as Target Point near the upper trendline.
---
🎯 Target Analysis
My blue arrow points to a resistance zone near the top of the ascending channel.
The Target Point zone is around $285 – $288.
→ That’s roughly +6% to +7% upside from the current level.
---
📈 Summary
Type Level (USD) Notes
Entry (current) 269–270 Price retesting support/trendline
Target 285 – 288 Channel top / bullish target
Stop-loss (recommended) 260 – 261 Below trendline & Ichimoku cloud
---
⚠ Notes
If AAPL closes below $260, this trendline support breaks, and momentum may shift bearish.
But as long as it stays above $265, it looks strong toward $285+.
Watch volume — a breakout above $275 with volume would confirm move to target.
Here’s a detailed read of the setup my drawn 👇
---
🧭 Chart Overview
Current Price: ≈ $269.4
Trend: Strong uptrend (price holding above Ichimoku cloud & rising trendline)
Support Zone: Around $265 – $266 (where price retested the trendline + cloud)
Resistance/Target Box: Marked on my chart as Target Point near the upper trendline.
---
🎯 Target Analysis
My blue arrow points to a resistance zone near the top of the ascending channel.
The Target Point zone is around $285 – $288.
→ That’s roughly +6% to +7% upside from the current level.
---
📈 Summary
Type Level (USD) Notes
Entry (current) 269–270 Price retesting support/trendline
Target 285 – 288 Channel top / bullish target
Stop-loss (recommended) 260 – 261 Below trendline & Ichimoku cloud
---
⚠ Notes
If AAPL closes below $260, this trendline support breaks, and momentum may shift bearish.
But as long as it stays above $265, it looks strong toward $285+.
Watch volume — a breakout above $275 with volume would confirm move to target.
Transaction en cours
active 📲 Join telegram channel free .
t.me/addlist/dg3uSwzkMSplNjFk
Forex, Gold & Crypto Signals with detailed analysis & get consistent results.
t.me/addlist/dg3uSwzkMSplNjFk
Gold Signal's with proper TP & SL for high profit opportunities.
t.me/addlist/dg3uSwzkMSplNjFk
Forex, Gold & Crypto Signals with detailed analysis & get consistent results.
t.me/addlist/dg3uSwzkMSplNjFk
Gold Signal's with proper TP & SL for high profit opportunities.
Publications connexes
Clause de non-responsabilité
Les informations et publications ne sont pas destinées à être, et ne constituent pas, des conseils ou recommandations financiers, d'investissement, de trading ou autres fournis ou approuvés par TradingView. Pour en savoir plus, consultez les Conditions d'utilisation.
📲 Join telegram channel free .
t.me/addlist/dg3uSwzkMSplNjFk
Forex, Gold & Crypto Signals with detailed analysis & get consistent results.
t.me/addlist/dg3uSwzkMSplNjFk
Gold Signal's with proper TP & SL for high profit opportunities.
t.me/addlist/dg3uSwzkMSplNjFk
Forex, Gold & Crypto Signals with detailed analysis & get consistent results.
t.me/addlist/dg3uSwzkMSplNjFk
Gold Signal's with proper TP & SL for high profit opportunities.
Publications connexes
Clause de non-responsabilité
Les informations et publications ne sont pas destinées à être, et ne constituent pas, des conseils ou recommandations financiers, d'investissement, de trading ou autres fournis ou approuvés par TradingView. Pour en savoir plus, consultez les Conditions d'utilisation.