Script: NSE:ABCAPITAL | Timeframe: Daily | Pattern: Cup and Handle | Idea: Swing/Positional
Idea Analysis:
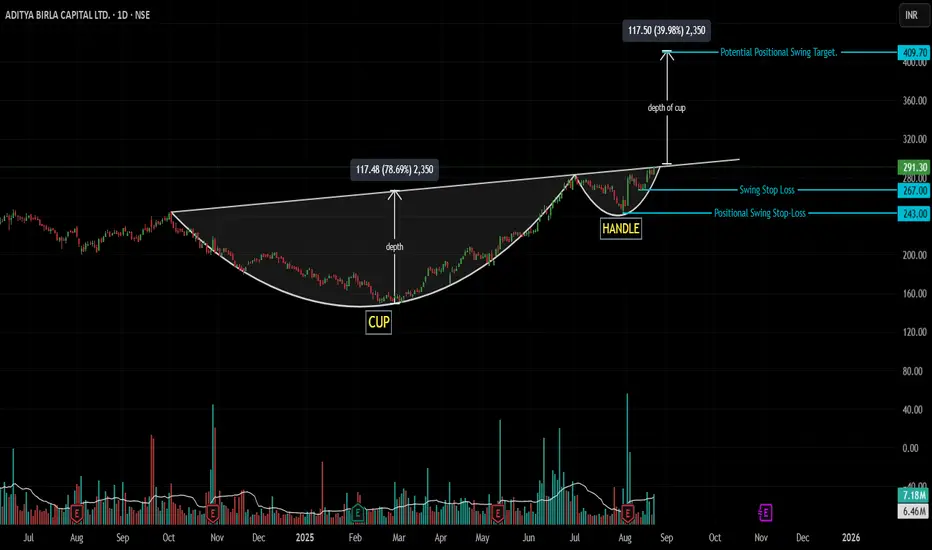
Aditya Birla Capital is demonstrating exceptional strength! After a brilliant bullish run that defined the right side of its Cup, the stock is now completing a bullish consolidation and is primed for its next major breakout.
The Powerful Run: The stock exhibited explosive momentum as it rounded off the bottom of its Cup, rallying powerfully from its lows to re-test the key resistance near ₹290. This strong impulse move is a clear sign of dominant buying interest.
The Short Rest: Following every strong run comes a period of rest. Since its peak, the price has been forming the Handle of a large Cup & Handle pattern. This isn't a sign of weakness, but a healthy bullish consolidation—a catch of breath where the stock digests its previous gains.
The Next Leg: This handle has now tightened sufficiently, bringing volatility to a contraction point. The stock is coiling at the handle's upper trendline, suggesting the "short rest" may be over. A breakout would signal the beginning of the next leg up in the larger bullish narrative.
Why This Looks Bullish:
Strong Momentum: The prior run proves there are strong buyers in this stock.
Constructive Action: The handle is a classic bullish continuation pattern or VCP (Volatility Contraction Pattern)
Volume Confirmation: A breakout with high volume will confirm the resumption of the uptrend.
Trade Strategy:
For Both Swing & Positional Traders:
Entry: On the closing of a candle that breaks above the trendline. The ideal candle is thick and green with minimal upper wick, confirming the end of the rest period.
Stop Loss (SL): Low of the breakout candle or ₹267 (Placed below the very recent low).
Stop Loss (SL) (Positional): ~₹243 (Low of the handle's low)
Target 1 (Swing): Initial Risk-to-Reward 1:2. Trail stops after.
Potential Long-term Target : ~₹410 (2-3 months horizon)
Key Levels:
Pattern Breakout: Above the trendline.
Major Support/Stop Level: ₹243
Positional Target (Pattern Projection): ₹400/410
⚠️ Disclaimer:
This post is for educational purposes only and does not constitute financial advice. Trading stocks involves substantial risk of loss and is not suitable for every investor. The price targets and levels are hypothetical projections based on technical analysis and are not a guarantee of future performance. Always conduct your own research and consider your risk tolerance before making any investment decisions.
👍 If you agree with this analysis, please give it a Boost!
💬 Which stock would you like to see featured in the next technical breakdown? Let me know in the comments!
Idea Analysis:
Aditya Birla Capital is demonstrating exceptional strength! After a brilliant bullish run that defined the right side of its Cup, the stock is now completing a bullish consolidation and is primed for its next major breakout.
The Powerful Run: The stock exhibited explosive momentum as it rounded off the bottom of its Cup, rallying powerfully from its lows to re-test the key resistance near ₹290. This strong impulse move is a clear sign of dominant buying interest.
The Short Rest: Following every strong run comes a period of rest. Since its peak, the price has been forming the Handle of a large Cup & Handle pattern. This isn't a sign of weakness, but a healthy bullish consolidation—a catch of breath where the stock digests its previous gains.
The Next Leg: This handle has now tightened sufficiently, bringing volatility to a contraction point. The stock is coiling at the handle's upper trendline, suggesting the "short rest" may be over. A breakout would signal the beginning of the next leg up in the larger bullish narrative.
Why This Looks Bullish:
Strong Momentum: The prior run proves there are strong buyers in this stock.
Constructive Action: The handle is a classic bullish continuation pattern or VCP (Volatility Contraction Pattern)
Volume Confirmation: A breakout with high volume will confirm the resumption of the uptrend.
Trade Strategy:
For Both Swing & Positional Traders:
Entry: On the closing of a candle that breaks above the trendline. The ideal candle is thick and green with minimal upper wick, confirming the end of the rest period.
Stop Loss (SL): Low of the breakout candle or ₹267 (Placed below the very recent low).
Stop Loss (SL) (Positional): ~₹243 (Low of the handle's low)
Target 1 (Swing): Initial Risk-to-Reward 1:2. Trail stops after.
Potential Long-term Target : ~₹410 (2-3 months horizon)
Key Levels:
Pattern Breakout: Above the trendline.
Major Support/Stop Level: ₹243
Positional Target (Pattern Projection): ₹400/410
⚠️ Disclaimer:
This post is for educational purposes only and does not constitute financial advice. Trading stocks involves substantial risk of loss and is not suitable for every investor. The price targets and levels are hypothetical projections based on technical analysis and are not a guarantee of future performance. Always conduct your own research and consider your risk tolerance before making any investment decisions.
👍 If you agree with this analysis, please give it a Boost!
💬 Which stock would you like to see featured in the next technical breakdown? Let me know in the comments!
Transaction en cours
Medium level breakout is done, SL low of the BO candle. Trailing SL.Clause de non-responsabilité
Les informations et publications ne sont pas destinées à être, et ne constituent pas, des conseils ou recommandations financiers, d'investissement, de trading ou autres fournis ou approuvés par TradingView. Pour en savoir plus, consultez les Conditions d'utilisation.
Clause de non-responsabilité
Les informations et publications ne sont pas destinées à être, et ne constituent pas, des conseils ou recommandations financiers, d'investissement, de trading ou autres fournis ou approuvés par TradingView. Pour en savoir plus, consultez les Conditions d'utilisation.