(AFDI)
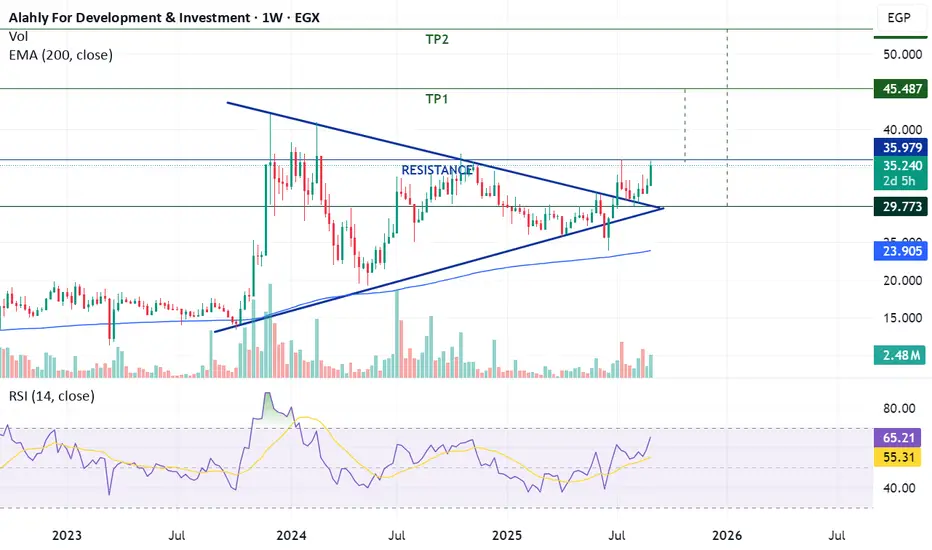
The stock previously formed a symmetrical triangle, which was successfully broken on July 9. On the weekly chart, a clear Cup & Handle pattern has also developed.
If the price breaks above 35.8 and sustains, this would validate the pattern and open the way for the following medium- to long-term targets: 45 – 53.
⚠ The stop-loss level after a confirmed breakout is set at 35.5.
Trade Setup:
-Stock Code: AFDI
-Potential Buy Range: 35.8 – 36.8
-Target Price 1 (TP1): 45
-Target Price 2 (TP2): 53
-Stop-Loss (SL): 35.5 after breakout
Clause de non-responsabilité
Les informations et publications ne sont pas destinées à être, et ne constituent pas, des conseils ou recommandations financiers, d'investissement, de trading ou autres fournis ou approuvés par TradingView. Pour en savoir plus, consultez les Conditions d'utilisation.
Clause de non-responsabilité
Les informations et publications ne sont pas destinées à être, et ne constituent pas, des conseils ou recommandations financiers, d'investissement, de trading ou autres fournis ou approuvés par TradingView. Pour en savoir plus, consultez les Conditions d'utilisation.