https://www.tradingview.com/x/YYASwHiR/
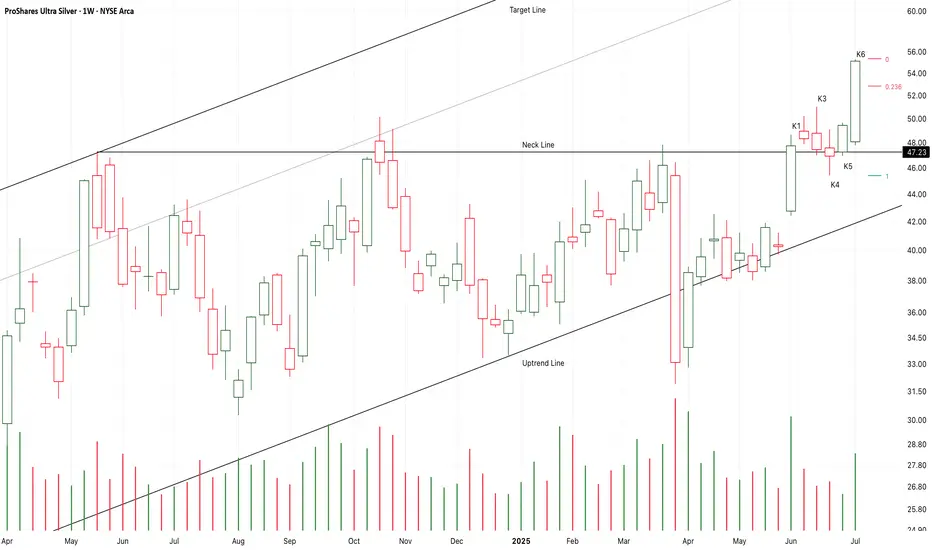
From K1 to K6,
It is a strong bullish three methods pattern,
It close upon the neck line of a potential bullish triangle.
It seems that the market will keep accelerating here.
So, I bought a small portion of AGQ at 55.35USD.
It is more and more clearly that the expensive metal such as Gold \Copper \ Ag is in the strong bullish market.
I will keep to buy in if the following candle fall to test 52.8USD area.
Long-55/Stop-50/Target-72
Long-52.8/Stop-50/Target-72
Clause de non-responsabilité
Les informations et publications ne sont pas destinées à être, et ne constituent pas, des conseils ou recommandations financiers, d'investissement, de trading ou autres fournis ou approuvés par TradingView. Pour en savoir plus, consultez les Conditions d'utilisation.
Clause de non-responsabilité
Les informations et publications ne sont pas destinées à être, et ne constituent pas, des conseils ou recommandations financiers, d'investissement, de trading ou autres fournis ou approuvés par TradingView. Pour en savoir plus, consultez les Conditions d'utilisation.