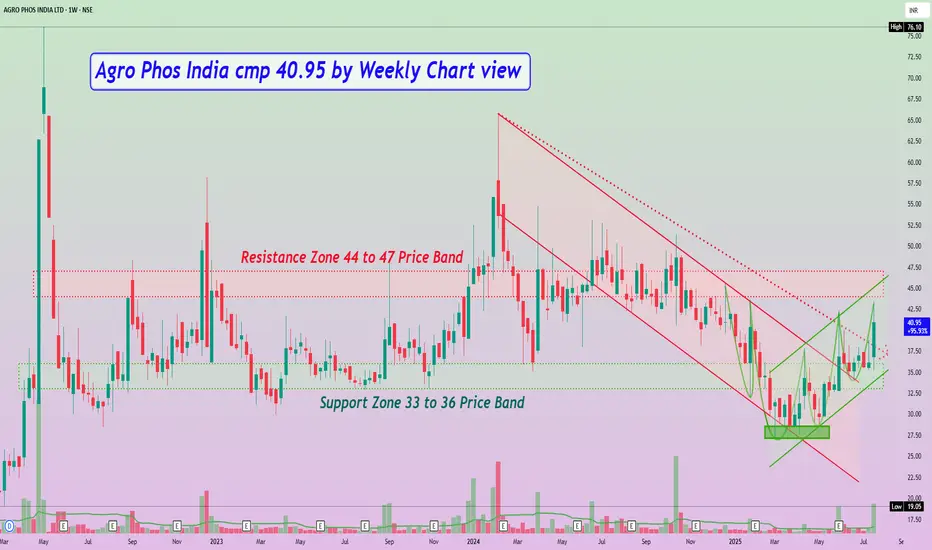
Agro Phos India cmp 40.95 by Weekly Chart view
- Support Zone 33 to 36 Price Band
- Resistance Zone 44 to 47 Price Band
- Falling Price Channel Breakout has well sustained
- Falling Resistance Trendline Breakout too is maintained
- Bullish Double Bottom "W" by repeat Bullish Rounding Bottoms
- Rising Price Channel momentum steadily taking a gradual uptrend
- Volumes have surged heavily over the week above avg traded quantity
- Most common Technical Indicators BB, EMA, MACD, RSI, SAR seen turning positive
Clause de non-responsabilité
Les informations et publications ne sont pas destinées à être, et ne constituent pas, des conseils ou recommandations financiers, d'investissement, de trading ou autres fournis ou approuvés par TradingView. Pour en savoir plus, consultez les Conditions d'utilisation.
Clause de non-responsabilité
Les informations et publications ne sont pas destinées à être, et ne constituent pas, des conseils ou recommandations financiers, d'investissement, de trading ou autres fournis ou approuvés par TradingView. Pour en savoir plus, consultez les Conditions d'utilisation.