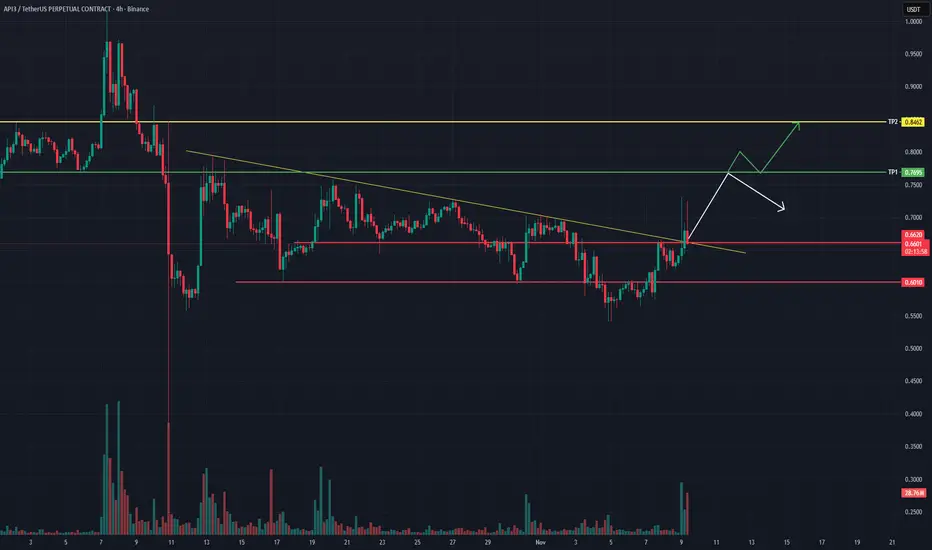
The price has successfully broken out of the descending trendline, showing early signs of bullish momentum.
If this breakout holds, potential targets are:
🎯 TP1: 0.7695
🎯 TP2: 0.8462
Support levels to watch for possible retest:
🟥 0.6620 and 0.6010
A healthy retest followed by strong volume confirmation could lead to a continuation toward higher levels.
📊 Breakout confirmed – waiting for retest and confirmation candle.
Clause de non-responsabilité
Les informations et publications ne sont pas destinées à être, et ne constituent pas, des conseils ou recommandations financiers, d'investissement, de trading ou autres fournis ou approuvés par TradingView. Pour en savoir plus, consultez les Conditions d'utilisation.
Clause de non-responsabilité
Les informations et publications ne sont pas destinées à être, et ne constituent pas, des conseils ou recommandations financiers, d'investissement, de trading ou autres fournis ou approuvés par TradingView. Pour en savoir plus, consultez les Conditions d'utilisation.