📊 Recent Price Snapshot
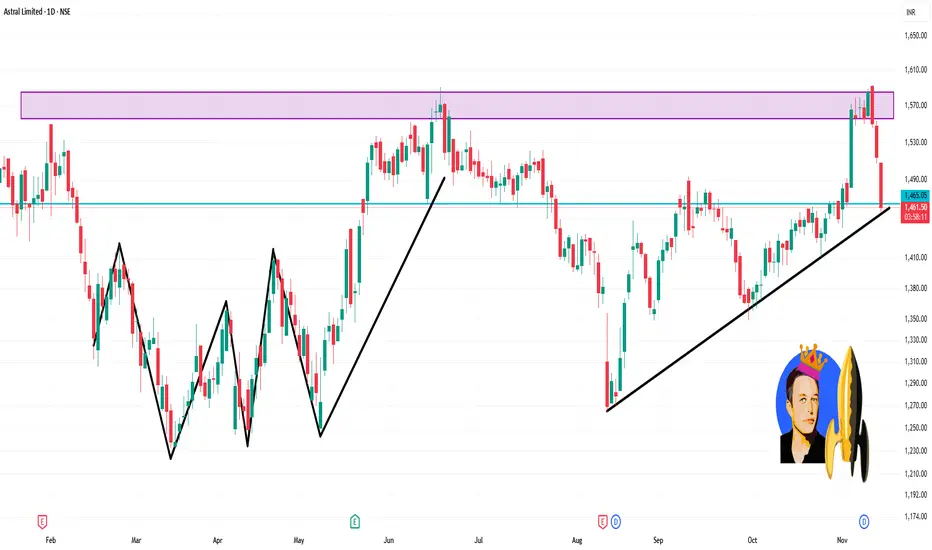
Latest closing around ₹1,460-₹1,470.
Daily range on latest day: High ~ ₹1,508, Low ~ ₹1,460.
52 week high ~ ₹1,867, 52 week low ~ ₹1,232.
🔍 Key Levels for the 1-Day Timeframe
Support Levels
Around ₹1,440–₹1,450: Recent lows touched ~1,445.
Further support nearer the 200-day SMA (~₹1,417) as per technical data.
Resistance Levels
Immediate resistance near ₹1,508 (recent high).
A stronger resistance zone around ₹1,520-₹1,550 (recent swing highs).
Price Action & Trend
The stock is trading above its 200-day average (~₹1,417) but the upward momentum appears weak.
On short term RSI/MFI metrics: MFI appears elevated (suggestive of some overbought behaviour).
Publications connexes
Clause de non-responsabilité
Les informations et publications ne sont pas destinées à être, et ne constituent pas, des conseils ou recommandations financiers, d'investissement, de trading ou autres fournis ou approuvés par TradingView. Pour en savoir plus, consultez les Conditions d'utilisation.