Professional Analysis of Boeing (BA) Stock – Daily Timeframe
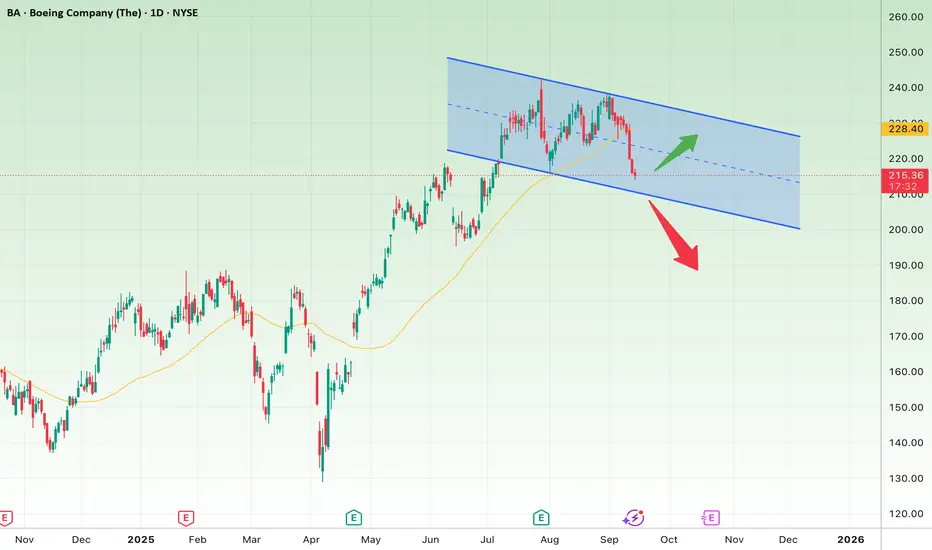
On the daily chart, Boeing (BA) has entered a descending channel after a strong rally from the $175 lows up to around $240 highs.
Bullish Scenario:
The price is currently around $215, near the channel’s lower boundary.
If this support holds and the stock reclaims the 50-day moving average (yellow line around $220), a rebound toward the channel’s upper boundary at $228 – $230 is likely.
A confirmed breakout above the channel could open the way toward $240.
Bearish Scenario:
If the $215 – $210 support zone breaks, the stock could slide down to the channel floor around $200 – $198.
A deeper breakdown below that may trigger further downside toward $185.
Conclusion:
Boeing is in a corrective channel. The $210 – $215 zone is a decisive level:
Holding it = potential rebound and short-term upside.
Breaking it = further weakness and extended downside risk.
Clause de non-responsabilité
Les informations et les publications ne sont pas destinées à être, et ne constituent pas, des conseils ou des recommandations en matière de finance, d'investissement, de trading ou d'autres types de conseils fournis ou approuvés par TradingView. Pour en savoir plus, consultez les Conditions d'utilisation.