BALAJEE - Descending Triangle Meets Multi-Pattern Confluence
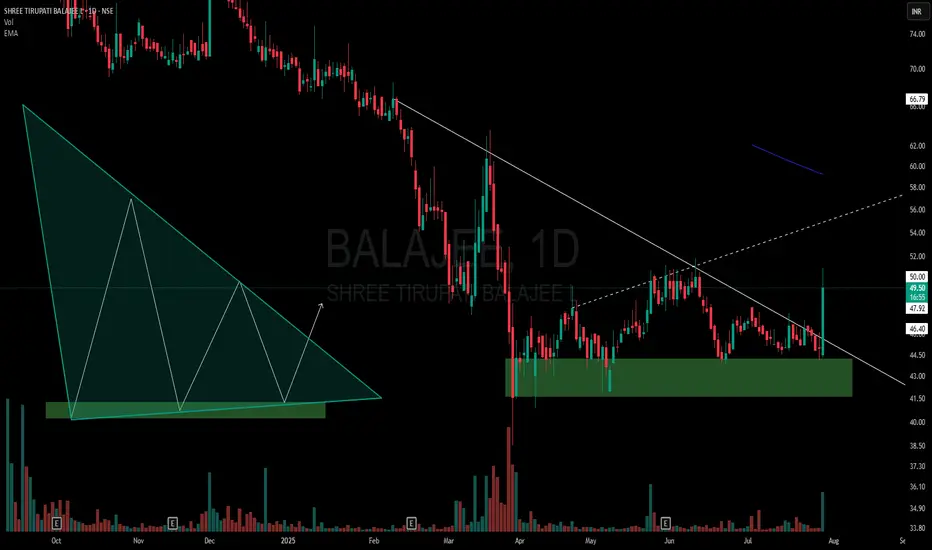
On the daily chart of Balajee, price action has formed a descending triangle right at the lower end of the trend:
🔻 Lower highs consistently pressuring horizontal support.
🟩 Price sitting within a clear demand zone, adding significance to the structure.
📊 Volume tapering off through consolidation, a classic triangle trait.
📐 Presence of a hidden counter-trend line (dotted) hinting at a potential broadening formation — showing a rare multi-pattern overlap.
Such setups are important not for predicting price, but for understanding how multiple structures can interact.
⚠️ Purely educational observation — no buy/sell advice.
🎯 Master My Self-Made Trading Strategy
📈 Telegram (Learn Today): t.me/hashtaghammer
✅ WhatsApp (Learn Today): wa.me/919455664601
📈 Telegram (Learn Today): t.me/hashtaghammer
✅ WhatsApp (Learn Today): wa.me/919455664601
Publications connexes
Clause de non-responsabilité
Les informations et les publications ne sont pas destinées à être, et ne constituent pas, des conseils ou des recommandations en matière de finance, d'investissement, de trading ou d'autres types de conseils fournis ou approuvés par TradingView. Pour en savoir plus, consultez les Conditions d'utilisation.