BANK NIFTY TRADING PLAN – 10-Oct-2025
📊 Chart Timeframe: 15-min
📍 Last Close: 56,143.15 | 🔻 Change: -27.40 pts (-0.05%)
📅 Analysis Based on Psychological & Technical Structure
🔍 Key Technical Zones
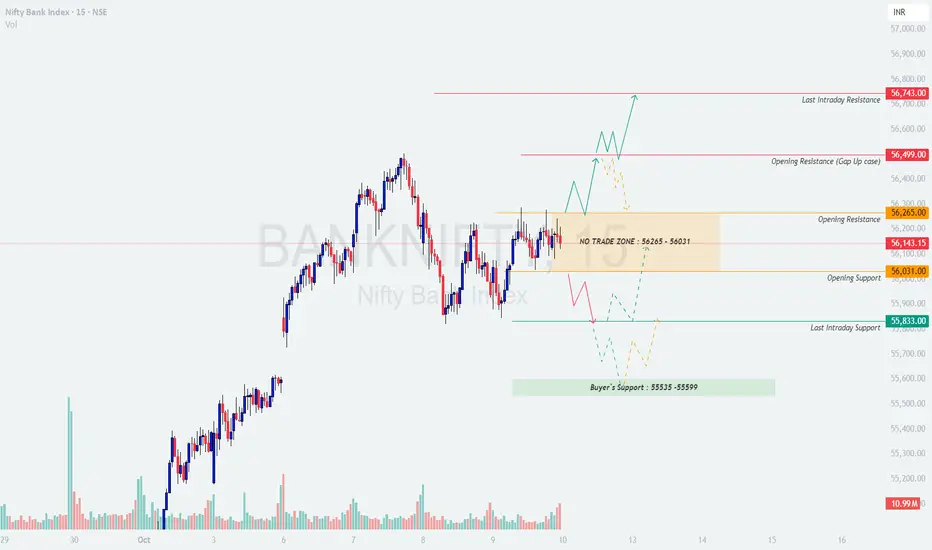
🟧 No Trade Zone: 56,265 – 56,031
🟥 Last Intraday Resistance: 56,743
🟠 Opening Resistance (Gap-Up Case): 56,499
🟩 Opening Support: 56,031
🟢 Last Intraday Support: 55,833
💚 Buyer’s Support Zone: 55,535 – 55,599
🚀 Scenario 1 – Gap Up Opening (200+ pts above 56,350)
If Bank Nifty opens near or above 56,350, it directly enters the opening resistance zone.
💡 Educational Tip:
Gap-up openings near major resistance levels are often liquidity traps. Always wait for price confirmation and volume support before taking directional trades. Patience gives better accuracy than early anticipation.
⚖️ Scenario 2 – Flat Opening (Around 56,100 ± 100 pts)
A flat opening keeps Bank Nifty inside the No Trade Zone (56,265–56,031), demanding patience and precision.
🧠 Educational Note:
Flat openings near mid-zones are “decision areas” — breakout confirmation candles (either side) generally dictate the intraday trend. Avoid overtrading during this phase.
📉 Scenario 3 – Gap Down Opening (200+ pts below 55,950)
If Bank Nifty opens near or below 55,950, it immediately enters the support-testing phase.
💬 Educational Insight:
Gap-down openings generally favor experienced traders who understand reversal patterns. Let the first 30 minutes decide whether the move is genuine or an overreaction — discipline matters more than direction here.
🛡️ Risk Management Tips for Options Traders
📊 Summary & Conclusion
🎯 Focus Zone for 10-Oct-2025:
🟩 55,599 → 55,535 (Buyers’ Defensive Zone)
🟥 56,499 → 56,743 (Sellers’ Control Zone)
📢 Disclaimer:
I am not a SEBI-registered analyst. The above analysis is meant purely for educational and informational purposes. Traders are advised to conduct their own research or consult a financial advisor before making trading decisions.
📊 Chart Timeframe: 15-min
📍 Last Close: 56,143.15 | 🔻 Change: -27.40 pts (-0.05%)
📅 Analysis Based on Psychological & Technical Structure
🔍 Key Technical Zones
🟧 No Trade Zone: 56,265 – 56,031
🟥 Last Intraday Resistance: 56,743
🟠 Opening Resistance (Gap-Up Case): 56,499
🟩 Opening Support: 56,031
🟢 Last Intraday Support: 55,833
💚 Buyer’s Support Zone: 55,535 – 55,599
🚀 Scenario 1 – Gap Up Opening (200+ pts above 56,350)
If Bank Nifty opens near or above 56,350, it directly enters the opening resistance zone.
- []Wait for the first 15–30 minutes — a strong close above 56,499 will confirm bullish continuation toward 56,743, the last intraday resistance.
[]Avoid buying immediately on open; instead, look for a healthy retest of 56,265–56,300 to establish long entries with a favorable risk/reward setup.
[]If prices face rejection from 56,499, expect mild profit booking that could drag Bank Nifty back toward the No Trade Zone (56,265–56,031).
[]Sustained rejection candles near 56,700–56,740 could trigger short opportunities for quick scalps — but only after confirmation via an hourly close below 56,499.]
💡 Educational Tip:
Gap-up openings near major resistance levels are often liquidity traps. Always wait for price confirmation and volume support before taking directional trades. Patience gives better accuracy than early anticipation.
⚖️ Scenario 2 – Flat Opening (Around 56,100 ± 100 pts)
A flat opening keeps Bank Nifty inside the No Trade Zone (56,265–56,031), demanding patience and precision.
- []If the index sustains above 56,265, intraday bulls may regain control, pushing prices toward 56,499 → 56,743.
[]A breakout candle above 56,265 with increasing volume can be used as an entry trigger for long positions.
[]On the other hand, failure to sustain above 56,031 will expose the index to weakness toward 55,833 and further down to 55,599–55,535 (Buyer’s Support).
[]Traders should ideally wait for a clean break from this zone before initiating any directional positions to avoid getting trapped in sideways movements.]
🧠 Educational Note:
Flat openings near mid-zones are “decision areas” — breakout confirmation candles (either side) generally dictate the intraday trend. Avoid overtrading during this phase.
📉 Scenario 3 – Gap Down Opening (200+ pts below 55,950)
If Bank Nifty opens near or below 55,950, it immediately enters the support-testing phase.
- []Monitor reactions closely near 55,833–55,800; a sharp recovery from this zone may trigger short-covering rallies toward 56,031–56,100.
[]However, sustained weakness below 55,800 may lead prices toward the critical Buyer’s Support Zone (55,535–55,599) — a must-hold area for bulls.
[]A 15-min close below 55,535 can attract panic selling and accelerate downside momentum toward 55,300–55,250.
[]Avoid aggressive buying in a gap-down scenario unless there’s a clear reversal candle or double-bottom formation within the buyer’s zone.]
💬 Educational Insight:
Gap-down openings generally favor experienced traders who understand reversal patterns. Let the first 30 minutes decide whether the move is genuine or an overreaction — discipline matters more than direction here.
🛡️ Risk Management Tips for Options Traders
- []Never risk more than 2%–3% of trading capital per trade.
[]Use a stop loss based on 15-min candle close, not random points.
[]Avoid buying deep OTM options — focus on ATM or slightly ITM for better delta exposure.
[]When volatility is high, consider using vertical spreads (Bull Call / Bear Put) to manage theta decay.
[]Book partial profits at 1:1 risk–reward; let the rest trail with stop adjustments.
[]Do not hold losing positions beyond 2:45 PM — protect your capital before time decay erodes premiums. 💎]
📊 Summary & Conclusion
- []Bank Nifty currently trades within a consolidation band, with directional clarity expected only outside 56,265–56,031.
[]Above 56,499, momentum buyers may target 56,743, while sustained weakness below 55,833 can pull prices toward 55,599–55,535. - Traders should prioritize level confirmations, volume analysis, and strict stop-loss adherence for consistent performance.]
🎯 Focus Zone for 10-Oct-2025:
🟩 55,599 → 55,535 (Buyers’ Defensive Zone)
🟥 56,499 → 56,743 (Sellers’ Control Zone)
📢 Disclaimer:
I am not a SEBI-registered analyst. The above analysis is meant purely for educational and informational purposes. Traders are advised to conduct their own research or consult a financial advisor before making trading decisions.
Clause de non-responsabilité
Les informations et les publications ne sont pas destinées à être, et ne constituent pas, des conseils ou des recommandations en matière de finance, d'investissement, de trading ou d'autres types de conseils fournis ou approuvés par TradingView. Pour en savoir plus, consultez les Conditions d'utilisation.