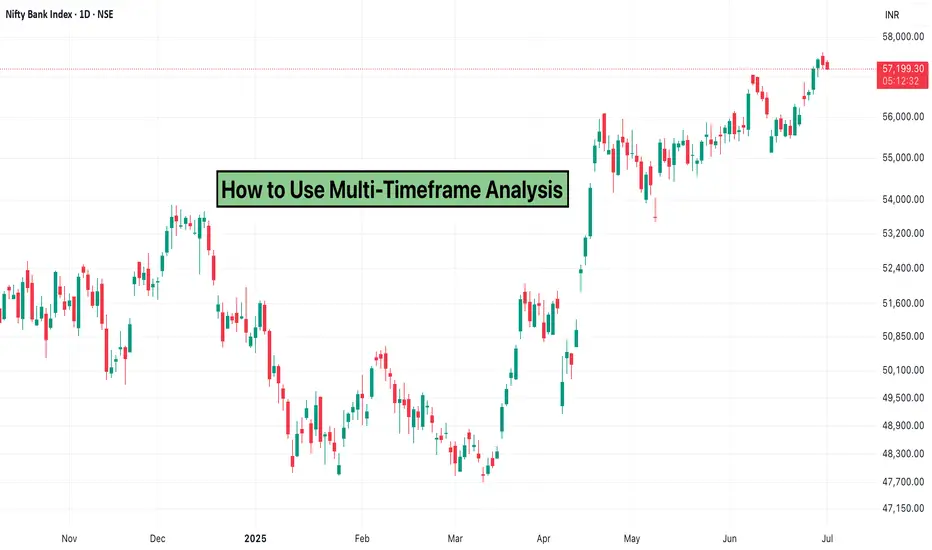
Trading stocks successfully isn’t just about spotting a pattern or reading a signal—it’s about understanding the bigger picture. That’s where Multi-Timeframe Analysis (MTFA) becomes one of the most useful tools in your trading toolkit.
Whether you’re an intraday trader or a swing trader, looking at multiple timeframes helps you confirm trends, reduce false entries, and improve the accuracy of your trades. Let’s break down how to use this strategy specifically for stock trading.
Why Use Multiple Timeframes?
Stocks can behave differently over different time horizons. A stock that looks weak on a 5-minute chart might actually be in a strong uptrend on the daily chart. By using more than one timeframe, you avoid getting trapped by short-term noise or trading against the primary trend.
Multi-timeframe analysis helps you:
Step-by-Step: Applying MTFA to Stocks
Let’s say you’re looking to trade a stock like Reliance or TCS.
Start with the Higher Timeframe
Begin by analyzing the daily or weekly chart. This helps you identify the broader trend—whether the stock is in an uptrend, downtrend, or moving sideways. Mark important levels such as swing highs/lows, support and resistance, and trendlines.
Move to the Intermediate Timeframe
Use the 1-hour or 30-minute chart to observe structure. Check for pullbacks, consolidations, or early signs of a reversal. This helps you spot where the stock might be pausing before making its next move.
Zoom in for Entries
Finally, use the 15-minute or 5-minute chart to time your entries and exits. Look for candlestick patterns, volume confirmation, or indicator crossovers that align with your setup.
This is a multi-timeframe confirmation: the daily trend is up, the intermediate chart shows a healthy pullback, and the lower timeframe gives you a clean signal to enter.
Conclusion
Multi-Timeframe Analysis for stocks is not about complexity—it’s about trading with context. You’re no longer reacting to just one candle or signal, but making decisions based on a layered view of the market.
If you’re not already using this method, try analyzing your next trade across two or three timeframes. The clarity it brings could be the missing edge in your strategy.
Whether you’re an intraday trader or a swing trader, looking at multiple timeframes helps you confirm trends, reduce false entries, and improve the accuracy of your trades. Let’s break down how to use this strategy specifically for stock trading.
Why Use Multiple Timeframes?
Stocks can behave differently over different time horizons. A stock that looks weak on a 5-minute chart might actually be in a strong uptrend on the daily chart. By using more than one timeframe, you avoid getting trapped by short-term noise or trading against the primary trend.
Multi-timeframe analysis helps you:
- Understand the overall market direction
- Confirm whether a breakout or breakdown has support on higher timeframes
- Time your entry and exit more precisely
Step-by-Step: Applying MTFA to Stocks
Let’s say you’re looking to trade a stock like Reliance or TCS.
Start with the Higher Timeframe
Begin by analyzing the daily or weekly chart. This helps you identify the broader trend—whether the stock is in an uptrend, downtrend, or moving sideways. Mark important levels such as swing highs/lows, support and resistance, and trendlines.
Move to the Intermediate Timeframe
Use the 1-hour or 30-minute chart to observe structure. Check for pullbacks, consolidations, or early signs of a reversal. This helps you spot where the stock might be pausing before making its next move.
Zoom in for Entries
Finally, use the 15-minute or 5-minute chart to time your entries and exits. Look for candlestick patterns, volume confirmation, or indicator crossovers that align with your setup.
This is a multi-timeframe confirmation: the daily trend is up, the intermediate chart shows a healthy pullback, and the lower timeframe gives you a clean signal to enter.
Conclusion
Multi-Timeframe Analysis for stocks is not about complexity—it’s about trading with context. You’re no longer reacting to just one candle or signal, but making decisions based on a layered view of the market.
If you’re not already using this method, try analyzing your next trade across two or three timeframes. The clarity it brings could be the missing edge in your strategy.
Elevate your Trading Experience 🚀
📱 Download Dhan App on iOS and Android and Start Trading.
📱 Download Dhan App on iOS and Android and Start Trading.
Clause de non-responsabilité
Les informations et les publications ne sont pas destinées à être, et ne constituent pas, des conseils ou des recommandations en matière de finance, d'investissement, de trading ou d'autres types de conseils fournis ou approuvés par TradingView. Pour en savoir plus, consultez les Conditions d'utilisation.
