I'm no mathematician so I kind of pulled these numbers out my ass to be honest. But hear me out.
Assuming the trend continues (on increasing market cycle time), then these are some guesstimated numbers of this market cycle's bottom and top.
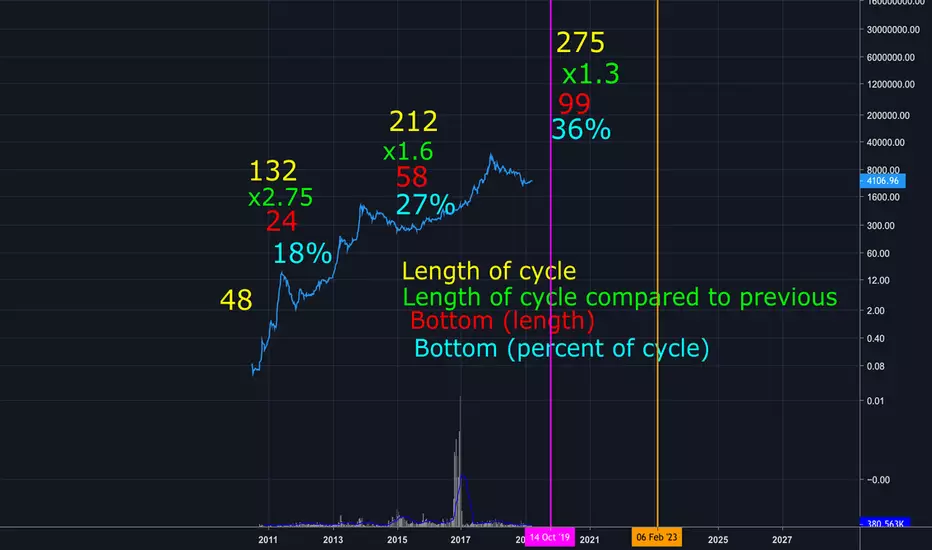
Pink vertical line is bottom, orange is top.
Bottom this autumn, with next top in 2022/2023.
Also note the time the market bottoms as a percent of the total trend time is getting later and later.
In the first cycle it bottomed at 18% of the cycle length, while the second cycle bottomed at 27% of the cycle length.
Believe it or not I'm not stoned making this post.
My guess is cryptos going to get real boring this year. Good luck everyone.
Assuming the trend continues (on increasing market cycle time), then these are some guesstimated numbers of this market cycle's bottom and top.
Pink vertical line is bottom, orange is top.
Bottom this autumn, with next top in 2022/2023.
Also note the time the market bottoms as a percent of the total trend time is getting later and later.
In the first cycle it bottomed at 18% of the cycle length, while the second cycle bottomed at 27% of the cycle length.
Believe it or not I'm not stoned making this post.
My guess is cryptos going to get real boring this year. Good luck everyone.
OP
Clause de non-responsabilité
Les informations et les publications ne sont pas destinées à être, et ne constituent pas, des conseils ou des recommandations en matière de finance, d'investissement, de trading ou d'autres types de conseils fournis ou approuvés par TradingView. Pour en savoir plus, consultez les Conditions d'utilisation.