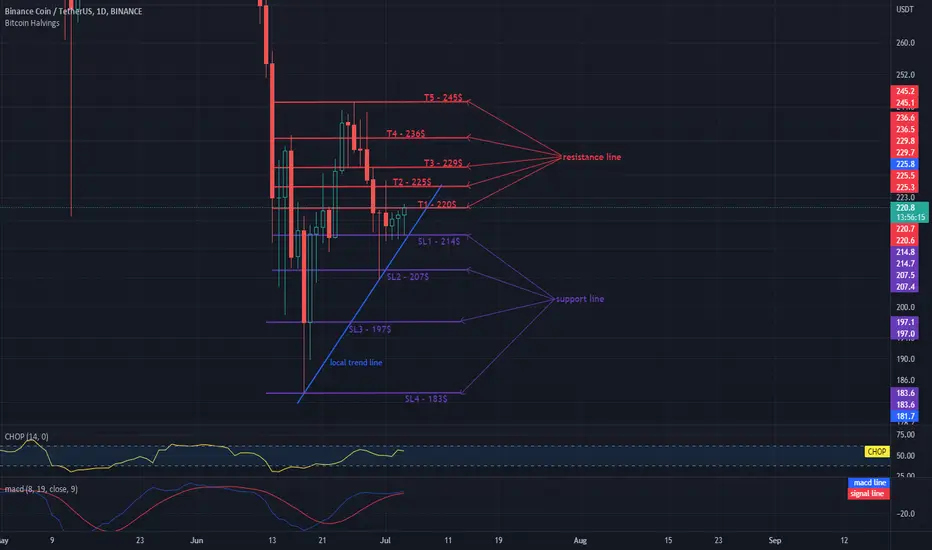
Hello everyone, let's take a look at the 1D BNB to USDT chart as you can see the price is moving above the local trendline.
Let's start by setting goals for the near future that we can consider:
T1 - $ 220
T2 - $ 225
T3 - $ 229
T4 - $ 236
and
T5 - $ 245
Now let's move on to the stop loss in case of further market declines:
SL1 - $ 214
SL2 - $ 207
SL3 - $ 197
and
SL4 - $ 183
Looking at the CHOP indicator, we can see that we have a lot of energy in the 1D range, while the MACD indicator shows a local upward trend.
Clause de non-responsabilité
Les informations et publications ne sont pas destinées à être, et ne constituent pas, des conseils ou recommandations financiers, d'investissement, de trading ou autres fournis ou approuvés par TradingView. Pour en savoir plus, consultez les Conditions d'utilisation.
Clause de non-responsabilité
Les informations et publications ne sont pas destinées à être, et ne constituent pas, des conseils ou recommandations financiers, d'investissement, de trading ou autres fournis ou approuvés par TradingView. Pour en savoir plus, consultez les Conditions d'utilisation.