Parameter Data
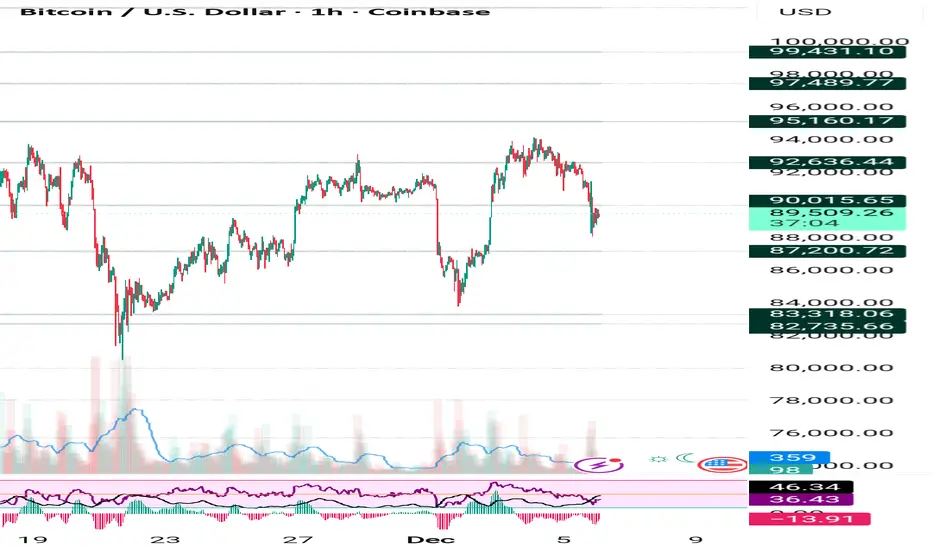
Asset Name Bitcoin: $89,461.64 [ 🟥 -2.91% ] (LTP: Dec 5, 2025, 21:20 UTC)
Price Movement Consolidation near support. Upside targets are [R1: $91,900] and [R2: $94,700]. Downside breakdown below [Alternate Scenario breaking point: $88,000] targets [S1: $85,000] and [S2: $82,000].
Current Trade 🟨 Neutral/Range / Long on bounce from $88,000, Short on failure at $93,500 / SL: $87,800 (Long), $93,700 (Short)
Risk Reward (R:R) 🟨 1 : 1.5 [ breakout above $94,700 & Breakdown below $88,000 ]
Confidence 🟨 20/30 (66.67%) (Neutral, waiting for structural confirmation of the next move.)
Probability 🟨 55% (Slight tilt toward Bullish continuation after consolidation.)
Market Phase 🟨 Consolidation/Contraction (Tight horizontal range between $88,000 and $93,000.)
DEMA Levels 🟨 Neutral/Bullish (Price is near 20-DEMA, but above 50-DEMA; mixed short-term signal.)
Supports 🟩 S1: $88,000 (Immediate Swing Low), 🟩 S2: $85,000 (Major Liquidation Support/Pivot), 🟩 S3: $80,000 (Strong Psychological/Annual Low Defense).
Resistances 🟥 R1: $91,900 (Intraday Pivot/Range Top), 🟥 R2: $94,700 (Key Weekly Resistance/Breakout Point), 🟥 R3: $100,000 (Major Psychological Barrier).
SMC Structure 🟨 Market Structure Shift (MSS) Awaited. The recent sharp drop was a liquidity sweep. A clean Break of Structure (BOS) above $94,700 is needed to confirm a continuation of the higher timeframe Bullish Order Flow.
Trap/Liquidity Zones 🟥 Liquidity Pool: Sell-Side Liquidity below $85,000. Liquidity Target: Buy-Side Liquidity above $95,000.
Max Pain 🟨 N/A (Futures data not applied.)
ADX/RSI/DMI 🟨 RSI (14): 50 (Neutral), ADX (14): 15 (Weak trend, confirming consolidation.)
Market Depth 🟨 N/A (Weekend data; Depth N/A.)
Volatility 🟨 Moderate (Volatility is compressed, typical of range trading.)
Source Ledger 🟩 Verified (Crypto 24/7): Price feed from Friday, Dec 5, 2025, 21:20 UTC.
OI 🟥 Down / Price Down (Open Interest dropped significantly on Friday, mostly from long liquidations.)
PCR 🟨 N/A (Data not directly available.)
VWAP 🟨 N/A (VWAP data not available.)
Turnover 🟨 Moderate (Lower weekend volume expected.)
Harmonic Pattern 🟨 Symmetrical Triangle (Forming on the 4H chart, indicating compression before a volatile move.)
IV/RV 🟨 Moderate IV (Implied Volatility is contracting, anticipating a directional break.)
Options Skew 🟨 Neutral Skew (Risk is currently balanced between Call and Put demand.)
Vanna/Charm 🟨 N/A (Neutral.)
Block Trades 🟩 Accumulation observed near the $88,000-$89,000 range, suggesting institutional defense.
COT Positioning 🟩 Net Long (Institutional funds remain net long on CME Bitcoin futures, despite the pullback.)
Cross-Asset Correlation 🟩 High Positive with Nasdaq 100 (NDX); High Inverse with USD Index (DXY).
ETF Rotation 🟩 Inflows (Spot Bitcoin ETFs continue to see net inflows on most days, supporting the long-term base.)
Sentiment Index 🟨 60 (Greed). Sentiment has pulled back from Extreme Greed but remains bullish.
OFI 🟨 Neutral (Order Flow indicates balanced buying and selling pressure in the current range.)
Delta 🟨 Cumulative Delta: Slightly Negative (Sellers had a slight edge during the sharp drop.)
VWAP Bands 🟨 N/A (VWAP band data not available.)
Rotation Metrics 🟩 Leading Indicator (Bitcoin is expected to outperform risk assets if the Fed cuts rates.)
Data Triangulation 🟩 Verified (Technical levels confirmed across multiple analyst reports; consolidation phase is the consensus.)
Clause de non-responsabilité
Les informations et publications ne sont pas destinées à être, et ne constituent pas, des conseils ou recommandations financiers, d'investissement, de trading ou autres fournis ou approuvés par TradingView. Pour en savoir plus, consultez les Conditions d'utilisation.
Clause de non-responsabilité
Les informations et publications ne sont pas destinées à être, et ne constituent pas, des conseils ou recommandations financiers, d'investissement, de trading ou autres fournis ou approuvés par TradingView. Pour en savoir plus, consultez les Conditions d'utilisation.