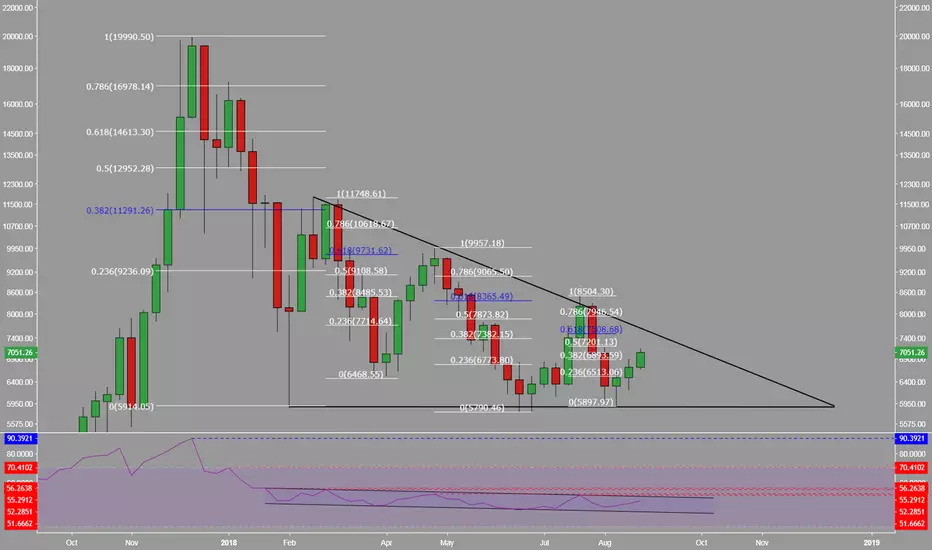
Since the beginning of December we've seen every subsequent bounce create a lower high. However if we map this lower high to the previous corrective cycle's fibs, we can barely get over the 618 fib level for the past two cycles. This also creates an interesting descending triangle--a bearish pattern when the prevailing trend is down. So if we try to map our current move, the height of it could potentially be around $7400-7500 max. We also have the weekly RSI showing that it's trapped in a channel and creating lower highs. Overall we are still in an overwhelming macro downtrend. Be cautious in this market in thinking we've marked the end of the bear cycle.
Hope y'all enjoy my analysis! Give me a thumbs up. Cheers!
Hope y'all enjoy my analysis! Give me a thumbs up. Cheers!
Note

Join our Crypto movement with Alpha Trades
Publications connexes
Clause de non-responsabilité
Les informations et les publications ne sont pas destinées à être, et ne constituent pas, des conseils ou des recommandations en matière de finance, d'investissement, de trading ou d'autres types de conseils fournis ou approuvés par TradingView. Pour en savoir plus, consultez les Conditions d'utilisation.