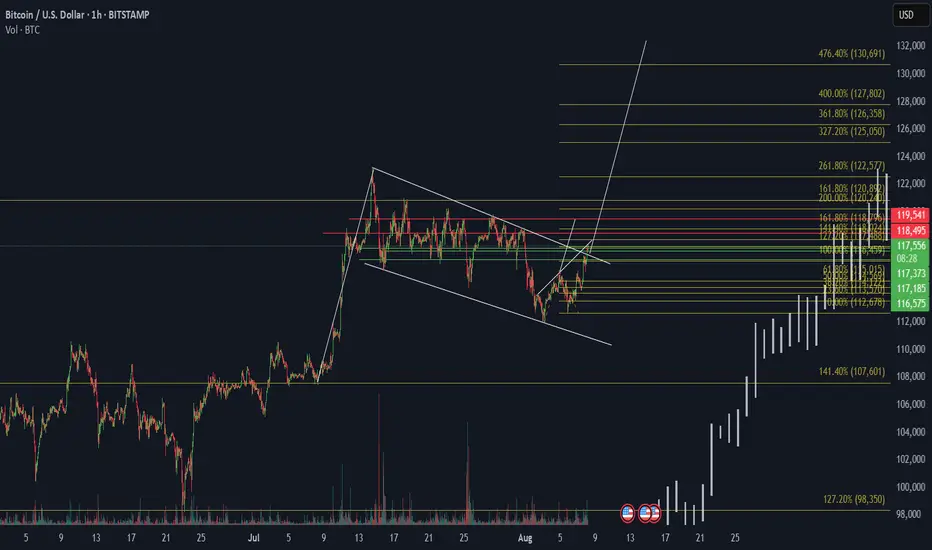
Technical Highlights:
Pattern Breakout: BTC has broken out of a descending wedge, a bullish reversal pattern.
Fibonacci Extensions: The price projection levels are drawn from the recent swing low to high:
1.618 (161.8%) 120,892
2.618 (261.8%) 122,577
3.618 (361.8%) 126,358
4.764 (476.4%) 130,691 = Target Area
Volume: A noticeable volume spike supports the breakout.
Current Price: Around 117,225 reclaiming above key resistance levels.
Bullish Confirmation Levels:
117,373 (Previous resistance now acting as support)
118,495 and 119,541 Strong horizontal resistance to clear
Sustained close above 120K could lead to a parabolic move toward 130K+
Clause de non-responsabilité
Les informations et les publications ne sont pas destinées à être, et ne constituent pas, des conseils ou des recommandations en matière de finance, d'investissement, de trading ou d'autres types de conseils fournis ou approuvés par TradingView. Pour en savoir plus, consultez les Conditions d'utilisation.