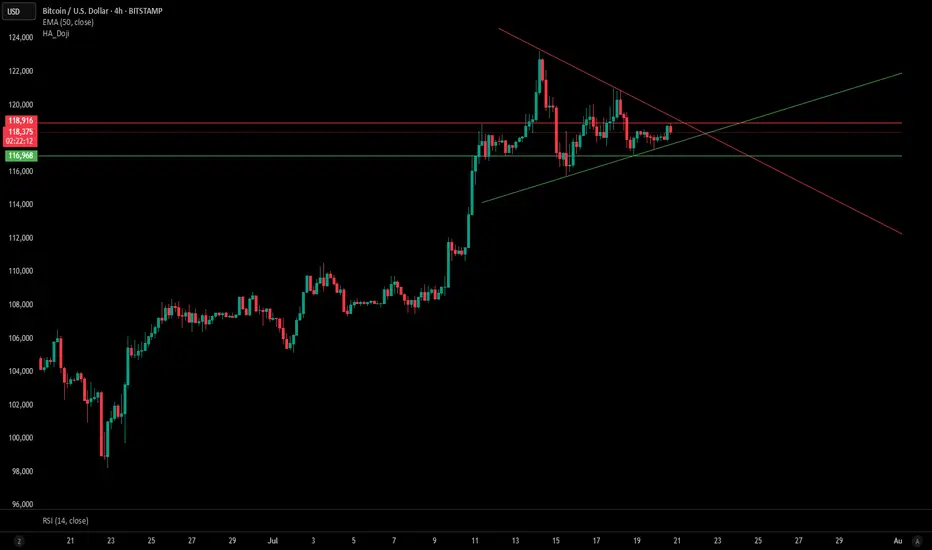
Bitcoin is currently consolidating within a symmetrical triangle pattern on the 4H chart, with both trendlines converging toward a decision point. Price is hovering just below the resistance line (~$118,900) and holding above key support at ~$116,968.
📊 Key Levels:
Resistance: $118,916 (triangle top / horizontal resistance)
Support: $116,968 (horizontal support)
EMA 50 (4H): $117,550 – currently acting as dynamic support
📉 RSI (14): Hovering near 50, indicating neutral momentum — awaiting confirmation of breakout direction.
A breakout above the descending trendline could trigger bullish momentum, while a break below the rising support may indicate further downside. Watch for volume confirmation on the breakout.
Clause de non-responsabilité
Les informations et les publications ne sont pas destinées à être, et ne constituent pas, des conseils ou des recommandations en matière de finance, d'investissement, de trading ou d'autres types de conseils fournis ou approuvés par TradingView. Pour en savoir plus, consultez les Conditions d'utilisation.