1. BTC

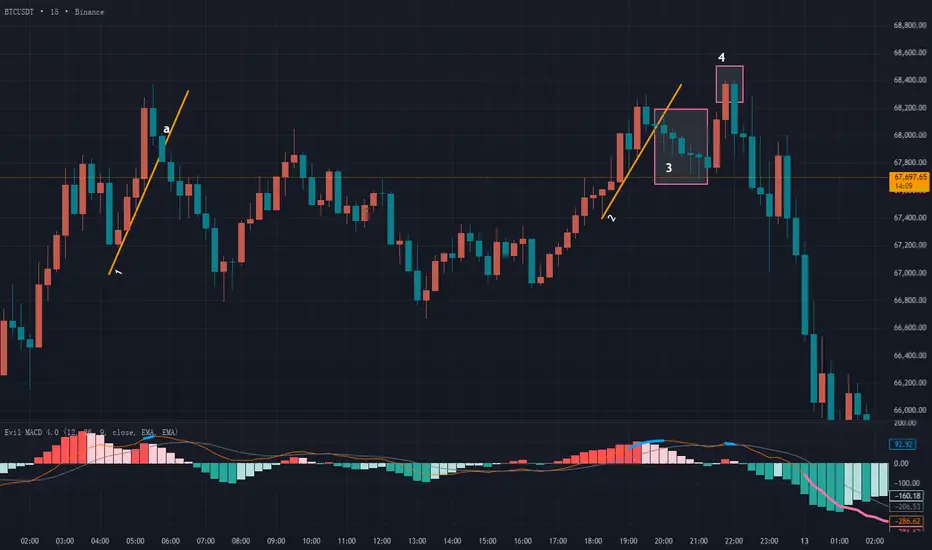
First, we can see Trendline 1. At the top of this trendline, a blue alert line appeared. Later, the trendline was broken downward at point a, ending the uptrend here.
The key question is whether point a can be considered a multi-to-short structural reversal. There is no fixed answer. Objectively, it is indeed a breakout. Point a is a solid candle with almost no wick, and it does not land exactly on the trendline—it clearly exceeds it. However, we also notice a previous bullish candle that is more than twice the size of point a’s bearish candle, indicating that the downward momentum at a is not yet very strong.
Thus, there is no definitive answer. This structural reversal has both pros and cons, and it depends on your risk preference. Aggressive traders may consider this a confirmed multi-to-short reversal point, while conservative traders may choose to skip it. Remember: risk and reward are always proportional. You either choose steady conservatism or aggressive growth—you cannot have both.
Afterwards, the market entered a consolidation phase. When Trendline 2 was formed, a blue alert line appeared at the top. The trendline itself was fine, but the subsequent breakout raised concerns. The breakout candle had a wick more than twice the size of its body, a classic multi-vs-short battle candle. When seeing such a candle, caution is needed—this could be a trap! In region 3, multiple doji and long-wick candles appeared, showing that buyers and sellers were fighting intensely, with no clear winner. This is an area full of uncertainty, and it’s best to skip trading here.
Indeed, the market later reversed again, confirming the previous analysis. A new blue alert segment appeared in region 4.
In this area, there were only two upward candles, insufficient to form a trendline, so no breakout point could be defined. This leads to a common pitfall: many traders, during review, try to “reverse-engineer” their trades from the price action. For example, in region 4, a bearish candle engulfed the previous bullish candle, followed by a noticeable drop, retracement, and then another decline. Some might think: next time this happens, I should short without hesitation.
Reflect on your past reviews—have you ever changed your trading rules based on a single segment of price action? The problem is, if you do change your rules and then encounter a similar setup, the market may not follow the previous scenario.
This is why consistency and discipline are crucial in trading systems. Trading is about finding fixed patterns in a random market. Random price movements do not give us a probabilistic edge, but through fixed rules, probability can be tilted in our favor. These rules must be consistent and repeatable. For example, in region 4, the bearish engulfing candle may have led to a large move this time, tempting traders with profit. But can you be sure that every time this pattern occurs, it will produce such a profit? Have you backtested it? Are there historical data? What is the success rate and risk-reward ratio if this trade is repeated multiple times?
All these questions are full of uncertainty. In contrast, trendline breakouts follow Wyckoff’s classical theory, developed in the 20th century and validated by decades of market experience. Many traders have studied it—it has stood the test of time.
We should focus on trades that give us higher confidence.
The common pitfall is that a segment of price action may be caused by random factors and unrelated to any pattern. Such tempting setups can mislead traders into thinking they might repeat. This is the mistake of reverse-engineering from outcomes. We need verified trading systems and discipline, supported by multiple backtests, rather than relying on a single exceptional move.
2. ETH

In region 1, a blue alert appeared, but there were not enough candles to draw a trendline, so trendline analysis was not possible.
After a period of sideways consolidation, Trendline 2 was formed. Although it was not validated multiple times by the market, the trendline meets the definition and is considered valid. At point a, the trendline broke downward. Point a is a solid candle with no wick, and compared to BTC Trendline 1, the multi-vs-short momentum difference here is not as extreme. Therefore, a can be considered a confirmed multi-to-short reversal point.
Whether you capture the following bearish move depends on your trading style. Trailing stop strategies yield different results for different traders. Regardless, identifying the structural reversal here can provide potential exit opportunities.
3. Gold

The gold chart clearly shows little volatility for the day, with sideways consolidation throughout. During such periods, trading should be avoided. Sideways markets are prone to losses; any direction is possible, entirely random.
Finally, at Trendline 1, a top blue alert appeared, and the trendline broke downward. This breakout is similar to BTC’s Trendline 1—technically valid but not particularly strong. Judging its quality depends on the trader’s personality and risk preference, so no universal conclusion can be made.
As for subsequent sudden moves, whether this entry point could predict profits is subject to chance, as explained earlier. Using random outcomes to adjust a trading system is a common mistake.
Conclusion
In the market, we must learn to distinguish “confirmation points worth trading” from “random traps.” Focus on verified methods rather than being misled by isolated price moves. Only then can trading be confident and systematic, not reliant on luck.
First, we can see Trendline 1. At the top of this trendline, a blue alert line appeared. Later, the trendline was broken downward at point a, ending the uptrend here.
The key question is whether point a can be considered a multi-to-short structural reversal. There is no fixed answer. Objectively, it is indeed a breakout. Point a is a solid candle with almost no wick, and it does not land exactly on the trendline—it clearly exceeds it. However, we also notice a previous bullish candle that is more than twice the size of point a’s bearish candle, indicating that the downward momentum at a is not yet very strong.
Thus, there is no definitive answer. This structural reversal has both pros and cons, and it depends on your risk preference. Aggressive traders may consider this a confirmed multi-to-short reversal point, while conservative traders may choose to skip it. Remember: risk and reward are always proportional. You either choose steady conservatism or aggressive growth—you cannot have both.
Afterwards, the market entered a consolidation phase. When Trendline 2 was formed, a blue alert line appeared at the top. The trendline itself was fine, but the subsequent breakout raised concerns. The breakout candle had a wick more than twice the size of its body, a classic multi-vs-short battle candle. When seeing such a candle, caution is needed—this could be a trap! In region 3, multiple doji and long-wick candles appeared, showing that buyers and sellers were fighting intensely, with no clear winner. This is an area full of uncertainty, and it’s best to skip trading here.
Indeed, the market later reversed again, confirming the previous analysis. A new blue alert segment appeared in region 4.
In this area, there were only two upward candles, insufficient to form a trendline, so no breakout point could be defined. This leads to a common pitfall: many traders, during review, try to “reverse-engineer” their trades from the price action. For example, in region 4, a bearish candle engulfed the previous bullish candle, followed by a noticeable drop, retracement, and then another decline. Some might think: next time this happens, I should short without hesitation.
Reflect on your past reviews—have you ever changed your trading rules based on a single segment of price action? The problem is, if you do change your rules and then encounter a similar setup, the market may not follow the previous scenario.
This is why consistency and discipline are crucial in trading systems. Trading is about finding fixed patterns in a random market. Random price movements do not give us a probabilistic edge, but through fixed rules, probability can be tilted in our favor. These rules must be consistent and repeatable. For example, in region 4, the bearish engulfing candle may have led to a large move this time, tempting traders with profit. But can you be sure that every time this pattern occurs, it will produce such a profit? Have you backtested it? Are there historical data? What is the success rate and risk-reward ratio if this trade is repeated multiple times?
All these questions are full of uncertainty. In contrast, trendline breakouts follow Wyckoff’s classical theory, developed in the 20th century and validated by decades of market experience. Many traders have studied it—it has stood the test of time.
We should focus on trades that give us higher confidence.
The common pitfall is that a segment of price action may be caused by random factors and unrelated to any pattern. Such tempting setups can mislead traders into thinking they might repeat. This is the mistake of reverse-engineering from outcomes. We need verified trading systems and discipline, supported by multiple backtests, rather than relying on a single exceptional move.
2. ETH
In region 1, a blue alert appeared, but there were not enough candles to draw a trendline, so trendline analysis was not possible.
After a period of sideways consolidation, Trendline 2 was formed. Although it was not validated multiple times by the market, the trendline meets the definition and is considered valid. At point a, the trendline broke downward. Point a is a solid candle with no wick, and compared to BTC Trendline 1, the multi-vs-short momentum difference here is not as extreme. Therefore, a can be considered a confirmed multi-to-short reversal point.
Whether you capture the following bearish move depends on your trading style. Trailing stop strategies yield different results for different traders. Regardless, identifying the structural reversal here can provide potential exit opportunities.
3. Gold
The gold chart clearly shows little volatility for the day, with sideways consolidation throughout. During such periods, trading should be avoided. Sideways markets are prone to losses; any direction is possible, entirely random.
Finally, at Trendline 1, a top blue alert appeared, and the trendline broke downward. This breakout is similar to BTC’s Trendline 1—technically valid but not particularly strong. Judging its quality depends on the trader’s personality and risk preference, so no universal conclusion can be made.
As for subsequent sudden moves, whether this entry point could predict profits is subject to chance, as explained earlier. Using random outcomes to adjust a trading system is a common mistake.
Conclusion
In the market, we must learn to distinguish “confirmation points worth trading” from “random traps.” Focus on verified methods rather than being misled by isolated price moves. Only then can trading be confident and systematic, not reliant on luck.
Discord:discord.com/users/1044898599974223902
Contact author to access Invite-Only script
公众号:介喜Jessie
以上渠道可联系作者开通指标
Contact author to access Invite-Only script
公众号:介喜Jessie
以上渠道可联系作者开通指标
Clause de non-responsabilité
Les informations et publications ne sont pas destinées à être, et ne constituent pas, des conseils ou recommandations financiers, d'investissement, de trading ou autres fournis ou approuvés par TradingView. Pour en savoir plus, consultez les Conditions d'utilisation.