Celer Network (CELR) is currently standing at a critical juncture that could define its next major move.
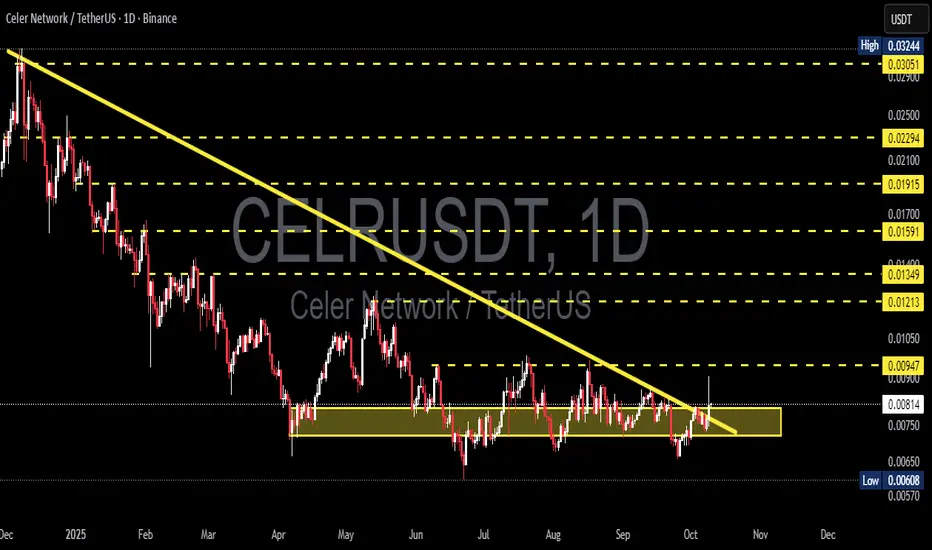
After months trapped below a long-term descending trendline, price is once again testing a crucial area — the accumulation zone between 0.008 and 0.0072.
This yellow zone has consistently acted as a strong demand area, showing that buyers have been quietly absorbing sell pressure.
At the same time, the long-term downtrend line remains a heavy ceiling that has capped every rally attempt so far.
Now, both forces are converging — making this a true decision point for CELR.
---
Pattern Description
The chart displays a descending triangle pattern characterized by:
A sequence of lower highs (declining selling pressure).
A horizontal support base around 0.008–0.0072 (firm buying interest).
This structure typically signals a compression phase — the market builds energy for its next big move.
A breakout could mark the beginning of a major trend reversal, while a breakdown could trigger a continuation of the broader downtrend.
---
Bullish Scenario — The Start of a Reversal?
If CELR manages to break and close above the descending trendline, especially with a daily close above 0.0094–0.0095, it would signal the first technical shift in momentum after months of decline.
A breakout accompanied by rising volume would confirm that buyers are taking control.
📈 Upside targets:
Target 1: 0.0095 – initial breakout retest zone.
Target 2: 0.0121 – first horizontal resistance.
Target 3: 0.0135 – a psychological level often triggering follow-up buying.
Extended targets: 0.0159 – 0.019 – medium-term expansion zone if bullish momentum sustains.
If CELR can hold above the breakout level on a successful retest, it may mark the beginning of a significant trend reversal phase driven by renewed demand.
---
Bearish Scenario — Continuation Risk
If CELR fails to break above the trendline and gets rejected around 0.0085–0.0090, selling pressure could return.
A daily close below 0.0072 would confirm a bearish breakdown and could lead price toward:
0.0068 – 0.0065 → the previous local low zone.
0.00608 → the next key support if selling continues.
This scenario would indicate that buyers are still weak and the long-term downtrend remains dominant.
---
Technical Context
The long-term descending trendline remains a major resistance area monitored by technical traders.
The yellow accumulation zone (0.008–0.0072) has acted as a high-liquidity demand region.
Volume confirmation is crucial — a breakout without volume often leads to a false move.
Momentum appears to be shifting slowly, but true confirmation will depend on how the next few daily closes unfold.
---
Conclusion
> CELR stands at a historic inflection point.
The clash between long-term selling pressure and strong accumulation support will determine its next trend direction.
A breakout above resistance could trigger a long-awaited trend reversal, while a breakdown below support could extend the bearish structure.
Patience and confirmation are key — not anticipation.
---
#CELRUSDT #CELR #CelerNetwork #CryptoAnalysis #TechnicalAnalysis #DescendingTriangle #BreakoutSetup #TrendReversal #DecisionPoint #CryptoTrading #SupportResistance #SwingTrade
✅ Get Free Signals! Join Our Telegram Channel Here: t.me/TheCryptoNuclear
✅ Twitter: twitter.com/crypto_nuclear
✅ Join Bybit : partner.bybit.com/b/nuclearvip
✅ Benefits : Lifetime Trading Fee Discount -50%
✅ Twitter: twitter.com/crypto_nuclear
✅ Join Bybit : partner.bybit.com/b/nuclearvip
✅ Benefits : Lifetime Trading Fee Discount -50%
Clause de non-responsabilité
Les informations et les publications ne sont pas destinées à être, et ne constituent pas, des conseils ou des recommandations en matière de finance, d'investissement, de trading ou d'autres types de conseils fournis ou approuvés par TradingView. Pour en savoir plus, consultez les Conditions d'utilisation.