The weekly chart of CL shows a divergence of MACD lines and sort of a divergence of the histogram. Both Force Indexes are lower than they were at the last swing high. 
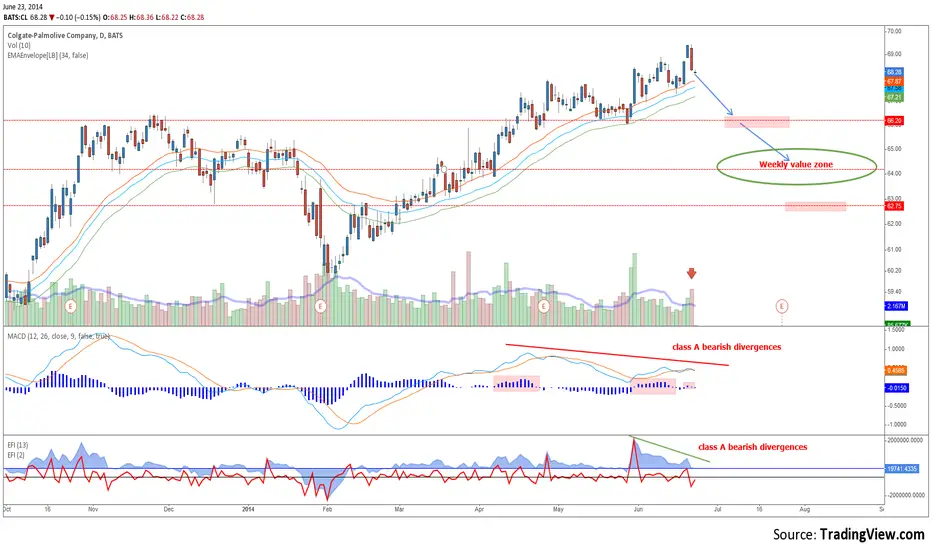
The daily chart has a closing marubozu candle, which might signal the start of the correction, note also the high volume. MACD lines and histogram show a class A bearish divergence, and so do both Force Indexes. First support comes at 66$. There is good support at 64$, where the weekly Wave stands approximately. That will be a level to watch closely if this correction is coming
The daily chart has a closing marubozu candle, which might signal the start of the correction, note also the high volume. MACD lines and histogram show a class A bearish divergence, and so do both Force Indexes. First support comes at 66$. There is good support at 64$, where the weekly Wave stands approximately. That will be a level to watch closely if this correction is coming
Clause de non-responsabilité
Les informations et publications ne sont pas destinées à être, et ne constituent pas, des conseils ou recommandations financiers, d'investissement, de trading ou autres fournis ou approuvés par TradingView. Pour en savoir plus, consultez les Conditions d'utilisation.
Clause de non-responsabilité
Les informations et publications ne sont pas destinées à être, et ne constituent pas, des conseils ou recommandations financiers, d'investissement, de trading ou autres fournis ou approuvés par TradingView. Pour en savoir plus, consultez les Conditions d'utilisation.