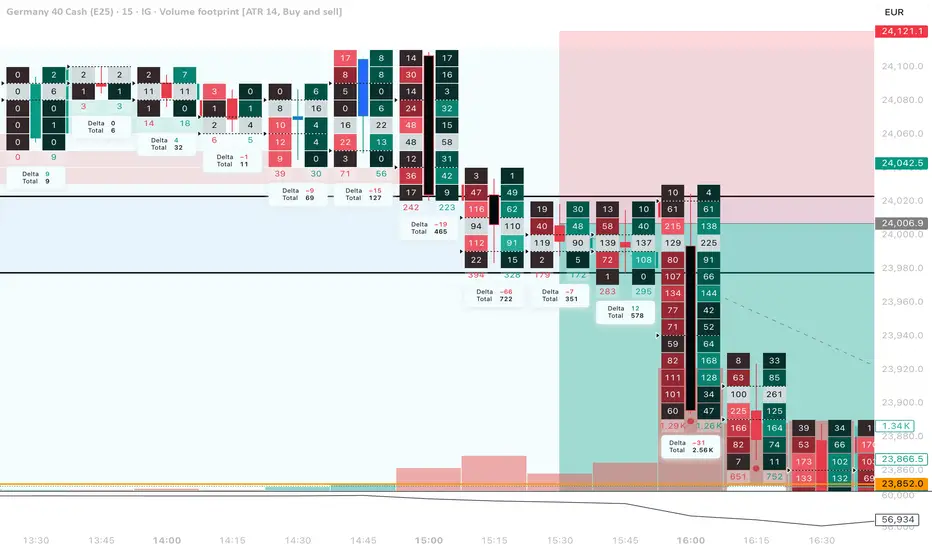
This analysis focuses on how price reacted around a key liquidity area on DAX.
The market first swept the previous high, triggering stop orders and collecting liquidity. After the sweep, the footprint data showed a concentration of aggressive orders hitting into the opposite side without follow-through.
Key observations:
1. Liquidity Sweep at the High
Price moved above the previous session’s high, taking stops and clearing liquidity before slowing down.
2. Absorption Characteristics
After the sweep, several candles formed with:
Elevated volume
Small real bodies
Opposing orderflow behavior
This commonly reflects absorption, where the market absorbs incoming orders instead of continuing the prior move.
3. Shift in Behavior
Once absorption appeared multiple times near the swing high, the market failed to continue upward and began showing signs of a shift in pressure.
4. Reversal Development
After the shift, price broke a minor structural level and continued lower, suggesting the absorbed area acted as temporary resistance.
This post highlights how liquidity behavior + volume response can help understand potential turning points in price.
It is not financial advice — just sharing market observation and technical behavior based on publicly visible price/volume patterns.
Clause de non-responsabilité
Les informations et publications ne sont pas destinées à être, et ne constituent pas, des conseils ou recommandations financiers, d'investissement, de trading ou autres fournis ou approuvés par TradingView. Pour en savoir plus, consultez les Conditions d'utilisation.
Clause de non-responsabilité
Les informations et publications ne sont pas destinées à être, et ne constituent pas, des conseils ou recommandations financiers, d'investissement, de trading ou autres fournis ou approuvés par TradingView. Pour en savoir plus, consultez les Conditions d'utilisation.