Thanks for the clarification! Yes — the chart **does** resemble an **Inverted Head and Shoulders** pattern (a bullish reversal pattern), especially visible in the price structure before the breakout above ₹6,278.
---
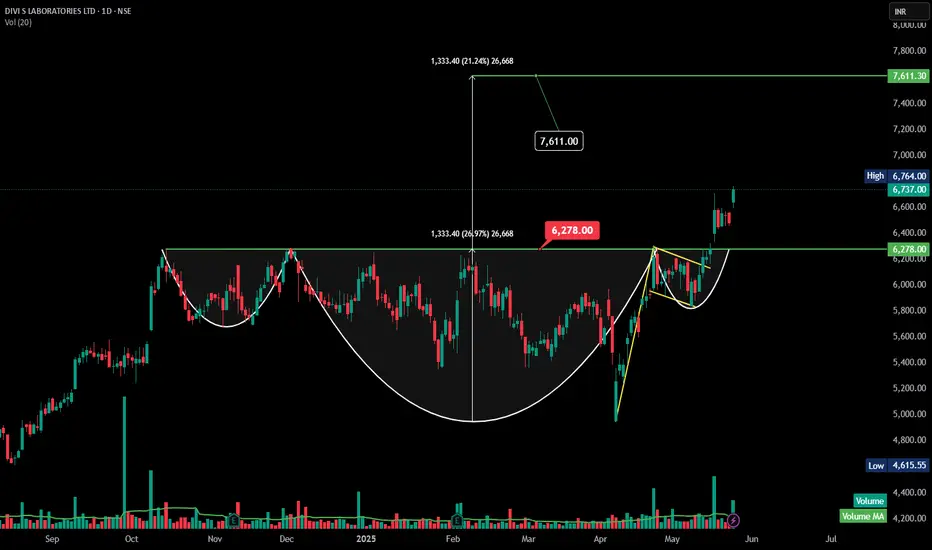
### 🟢 **Inverted Head and Shoulders – Analysis (Divi's Lab)**
#### **Pattern Structure:**
* **Left Shoulder:** Formed in March.
* **Head:** Deepest low around early April.
* **Right Shoulder:** Higher low formed in late April to early May.
* **Neckline:** Breakout above the ₹6,278 level confirms the pattern.
#### **Breakout Confirmation:**
* Breakout is strong, supported by **increasing volume**.
* Target derived from neckline to head height = approx. ₹1,333.
* **Target after breakout:** ₹6,278 + ₹1,333 = **₹7,611** (already marked on the chart).
---
---
### 🟢 **Inverted Head and Shoulders – Analysis (Divi's Lab)**
#### **Pattern Structure:**
* **Left Shoulder:** Formed in March.
* **Head:** Deepest low around early April.
* **Right Shoulder:** Higher low formed in late April to early May.
* **Neckline:** Breakout above the ₹6,278 level confirms the pattern.
#### **Breakout Confirmation:**
* Breakout is strong, supported by **increasing volume**.
* Target derived from neckline to head height = approx. ₹1,333.
* **Target after breakout:** ₹6,278 + ₹1,333 = **₹7,611** (already marked on the chart).
---
Clause de non-responsabilité
Les informations et publications ne sont pas destinées à être, et ne constituent pas, des conseils ou recommandations financiers, d'investissement, de trading ou autres fournis ou approuvés par TradingView. Pour en savoir plus, consultez les Conditions d'utilisation.
Clause de non-responsabilité
Les informations et publications ne sont pas destinées à être, et ne constituent pas, des conseils ou recommandations financiers, d'investissement, de trading ou autres fournis ou approuvés par TradingView. Pour en savoir plus, consultez les Conditions d'utilisation.