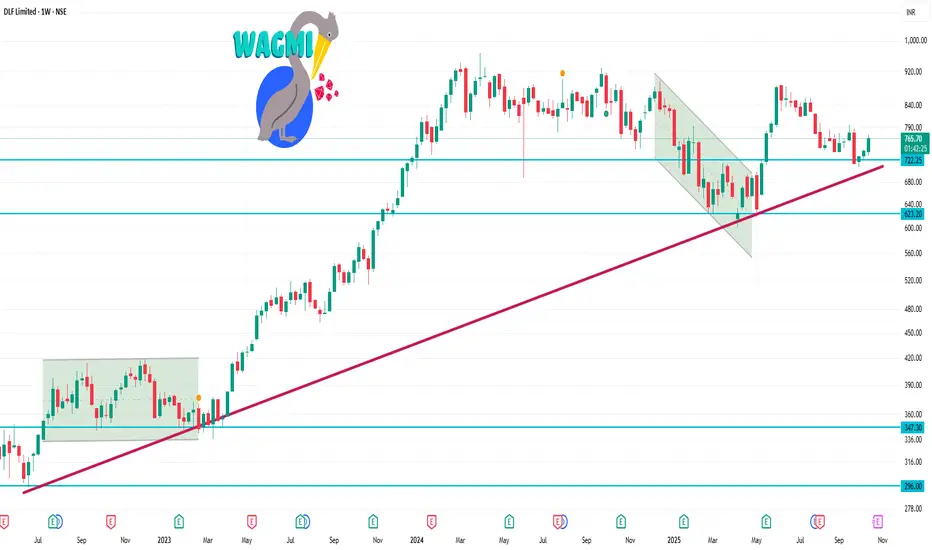
📈 Technical Indicators (1-Week Outlook)
Relative Strength Index (RSI): Currently at 66.74, indicating bullish momentum but approaching overbought territory.
Moving Averages:
5-Day EMA: ₹741.61 (Buy)
10-Day EMA: ₹735.62 (Buy)
50-Day SMA: ₹754.14 (Buy)
100-Day SMA: ₹789.39 (Sell)
200-Day SMA: ₹745.29 (Buy)
MACD (12,26): 7.21, suggesting a bullish trend.
Stochastic RSI: 79.63, nearing overbought levels.
Publications connexes
Clause de non-responsabilité
Les informations et publications ne sont pas destinées à être, et ne constituent pas, des conseils ou recommandations financiers, d'investissement, de trading ou autres fournis ou approuvés par TradingView. Pour en savoir plus, consultez les Conditions d'utilisation.