# Current Price Action and Market Context
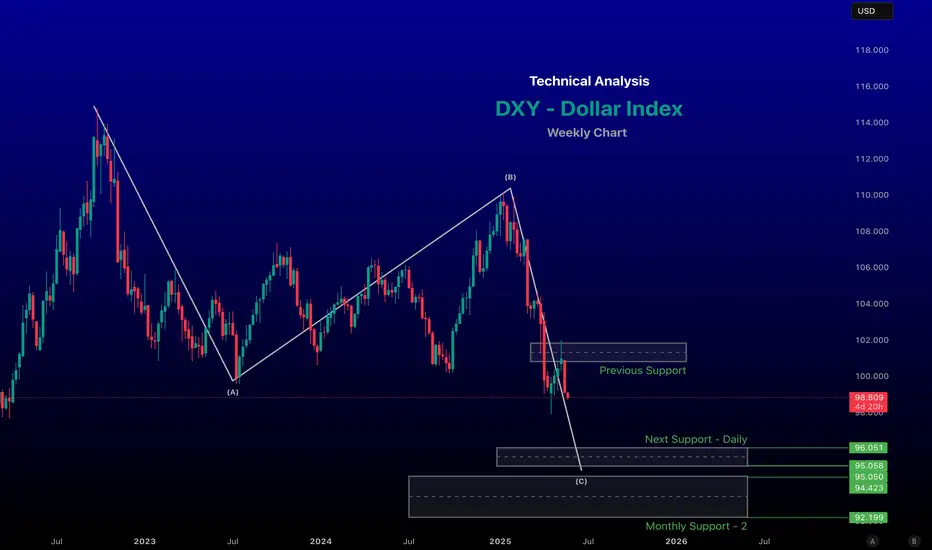
Recent Price Movement: As of May 23, 2025, the DXY closed at approximately 99.11, down 0.85% from the previous session's close of 99.96. The index has been trending downward, testing two-week lows near 99.14 after failing to reclaim the 100.50 level.
Bearish Momentum: The break below 97.50 on the monthly chart signals a bearish structure with lower highs and lower lows, suggesting continued selling pressure. The next major downside target is around 96.00, with a potential longer-term target near 92.00.
Key Fundamental Drivers: Recent weakness in the DXY is attributed to President Trump’s proposed 50% tariffs on European imports, which have undermined bullish momentum in the dollar. Additionally, anticipation of Federal Reserve interest rate decisions, upcoming US inflation data, and employment reports (e.g., Non-Farm Payrolls) will play a significant role in the DXY’s direction.
-- Chart for your reference --
-- Disclaimer --
This analysis is based on recent technical data and market sentiment from web sources and X posts. It is for informational purposes only and not financial advice. Trading involves high risks, and past performance does not guarantee future results. Always conduct your own research or consult a SEBI-registered advisor before trading.
renderwithme
Clause de non-responsabilité
Les informations et les publications ne sont pas destinées à être, et ne constituent pas, des conseils ou des recommandations en matière de finance, d'investissement, de trading ou d'autres types de conseils fournis ou approuvés par TradingView. Pour en savoir plus, consultez les Conditions d'utilisation.