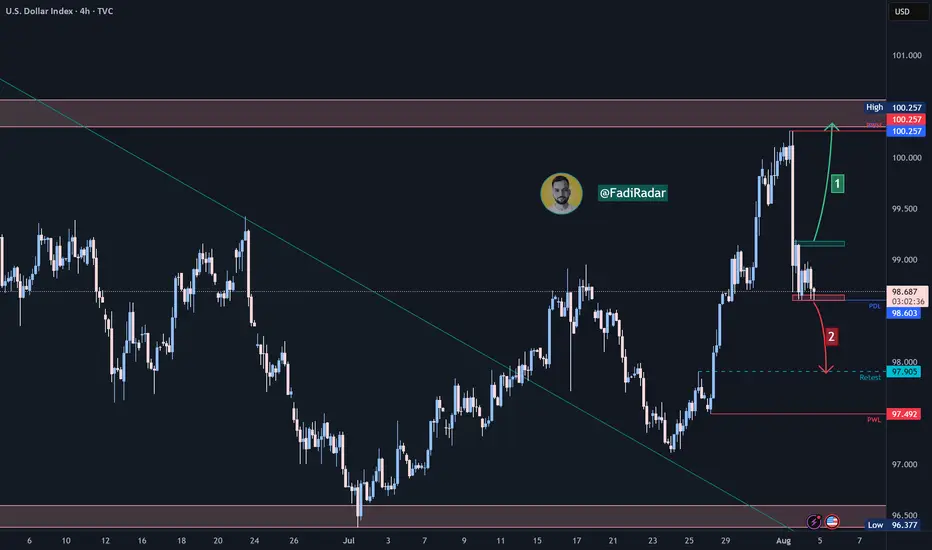
The DXY is currently moving sideways near the 98.65 support zone after a sharp drop from the 100.25 resistance, which marked last week’s high.
🔹 Bearish Scenario:
If the price breaks below 98.65 and holds, a continuation toward 97.90 is likely, with potential to reach the 97.50 support area.
🔹 Bullish Scenario:
If the price reclaims 99.00 and confirms support above it, we could see a retest of the 99.50–100.25 resistance zone, which remains key in the short term.
⚠️ Disclaimer:
This analysis is not financial advice. It is recommended to monitor the markets and carefully analyze the data before making any investment decisions.
Clause de non-responsabilité
Les informations et les publications ne sont pas destinées à être, et ne constituent pas, des conseils ou des recommandations en matière de finance, d'investissement, de trading ou d'autres types de conseils fournis ou approuvés par TradingView. Pour en savoir plus, consultez les Conditions d'utilisation.