1. Big Picture & Market Context
2. Multi-Timeframe Technical Snapshot
3. Elliott Wave & Harmonic Perspective
4. Key Support & Resistance Levels
5. Gann & Wyckoff Analysis
6. Intraday Trading Strategy (5M-1H Charts)
Bullish Scenario (Long):
Bearish Scenario (Short):
7. Swing Trading Strategy (4H-Daily Charts)
Swing Long:
Swing Short:
8. Indicator Cluster Consensus
Disclaimer: This is technical analysis, not financial advice. Always manage your risk and use stop-loss orders.
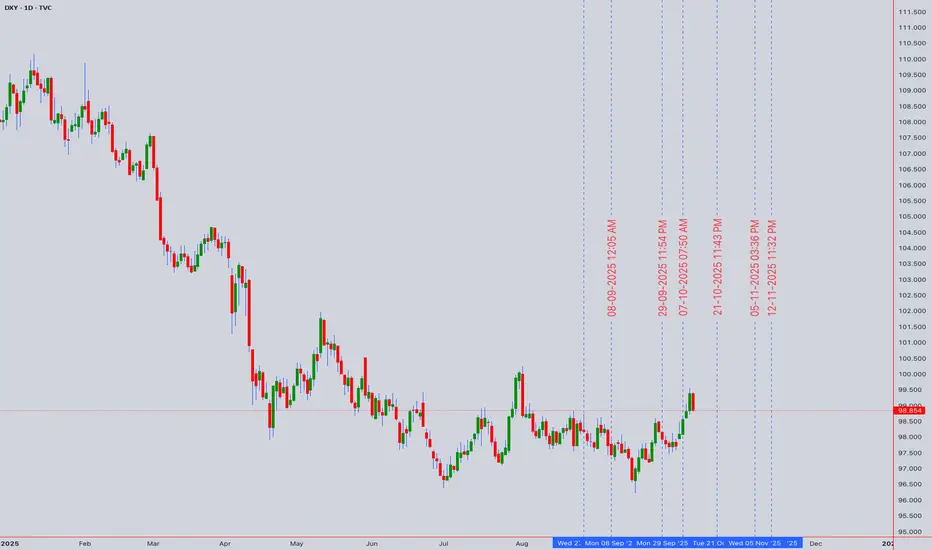
- The DXY is consolidating near a critical technical juncture. Geopolitical tensions and shifting rate expectations continue to be the primary drivers, creating volatility perfect for both intraday scalps and strategic swing positions.
2. Multi-Timeframe Technical Snapshot
- Monthly/Weekly (Swing): Price is squeezed between the 50-week EMA (support ~98.20) and the 200-day SMA (resistance ~99.50). A decisive break either way will set the medium-term trend.
- Daily (Swing & Intraday Bias): The chart shows a potential bearish flag formation following the recent decline. RSI (14) is neutral at 48, offering no extreme bias. The Ichimoku Cloud is thick above price, representing a significant resistance zone.
3. Elliott Wave & Harmonic Perspective
- The pullback from the 100.50 high is being analyzed as either a Wave 4 (corrective) or the start of a larger bearish impulse. The key Harmonic zone for a potential bullish reversal (Bat pattern) lies between 98.30 - 98.50.
4. Key Support & Resistance Levels
- Strong Resistance: 99.50 (200-day SMA & prior swing high)
- Minor Resistance: 99.10 (Intraday)
- Immediate Pivot: 98.85 (Current Price)
- Strong Support: 98.50 (50-week EMA & 50% Fibonacci)
- Critical Support: 98.20 (Breakdown Level)
5. Gann & Wyckoff Analysis
- Gann Square of 9: Key levels align with 98.50 (support) and 99.20 (resistance). A close above 99.20 could trigger a run towards 99.80.
- Wyckoff Cycle: Price action suggests we are in a possible Re-Distribution phase. A failure to hold 98.50 would signal a new Markdown phase, targeting 97.80.
6. Intraday Trading Strategy (5M-1H Charts)
Bullish Scenario (Long):
- Entry: 98.55 - 98.65 (with bullish reversal candlestick confirmation)
- Stop Loss: 98.35
- Take Profit 1: 98.95
- Take Profit 2: 99.15
Bearish Scenario (Short):
- Entry: 99.05 - 99.10 (with bearish rejection confirmation)
- Stop Loss: 99.30
- Take Profit 1: 98.70
- Take Profit 2: 98.50
7. Swing Trading Strategy (4H-Daily Charts)
Swing Long:
- Entry Zone: 98.30 - 98.45 (Accumulation Zone)
- Stop Loss: 97.90 (Daily Close)
- Target 1: 99.20
- Target 2: 99.80
Swing Short:
- Entry Trigger: Daily close below 98.20
- Stop Loss: 98.60
- Target 1: 97.80
- Target 2: 97.20
8. Indicator Cluster Consensus
- Bollinger Bands: Price is trading in the upper band, indicating neutral momentum. A squeeze is forming, signaling a volatility expansion is due.
- Anchored VWAP: (Anchored at last swing high) Price is below VWAP, indicating a Weak Bearish medium-term trend.
- Moving Averages: The 50 EMA is about to cross below the 200 SMA on the 4H chart—a potential "Death Cross" warning for the week ahead.
- Final Verdict: The DXY is at a make-or-break level. The bias is cautiously bearish below 99.10. The 98.50-98.20 zone is critical; a hold there could spark a relief rally, while a break opens the door for a significant swing down.
Disclaimer: This is technical analysis, not financial advice. Always manage your risk and use stop-loss orders.
I am nothing @shunya.trade
Clause de non-responsabilité
Les informations et publications ne sont pas destinées à être, et ne constituent pas, des conseils ou recommandations financiers, d'investissement, de trading ou autres fournis ou approuvés par TradingView. Pour en savoir plus, consultez les Conditions d'utilisation.