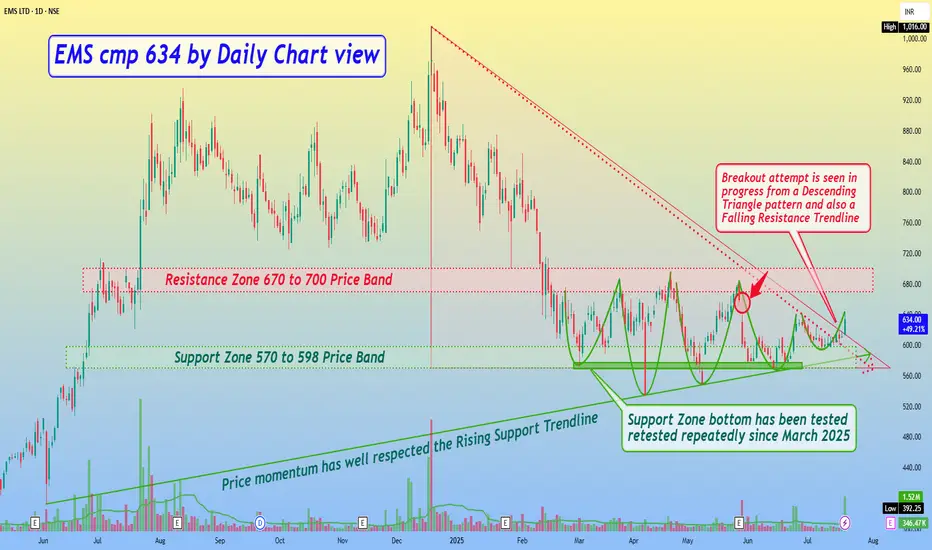
EMS cmp 634 by Daily Chart view
- Support Zone 570 to 598 Price Band
- Resistance Zone 670 to 700 Price Band
- Price momentum has well respected the Rising Support Trendline
- Support Zone bottom has been tested retested repeatedly since March 2025
- *Gap Down Opening of 29-May-2025 will act as tiny hurdle resistance crossing*
- Breakout attempt is seen in progress from a Descending Triangle pattern and also a Falling Resistance Trendline
Clause de non-responsabilité
Les informations et les publications ne sont pas destinées à être, et ne constituent pas, des conseils ou des recommandations en matière de finance, d'investissement, de trading ou d'autres types de conseils fournis ou approuvés par TradingView. Pour en savoir plus, consultez les Conditions d'utilisation.