🔍 Key Chart Patterns & Structures
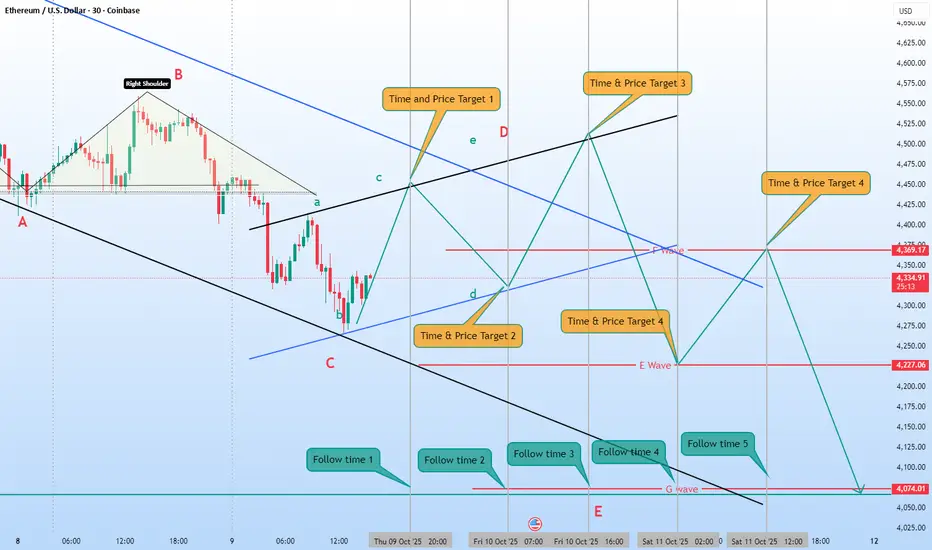
Head and Shoulders pattern marked at the top (with "Right Shoulder" labeled).
An ABCDE Elliott Wave structure is labeled (A to E).
Final movement projected as a G Wave toward the bottom.
📍 Major Time & Price Targets Identified
These are marked by orange labels:
Time & Price Target 1 — around 4,425 near intersection of trendlines D and e.
Time & Price Target 2 — lower target, around 4,275.
Time & Price Target 3 — higher target (~4,550), suggesting a bullish scenario.
Time & Price Target 4 — this label is duplicated at two different locations:
One around 4,275 again.
One higher near 4,425 (possibly indicating uncertainty between scenarios).
🕒 Follow Time Zones (Blue Labels)
These mark specific times to watch for possible market reactions or wave completions:
Follow Time 1–5 span from Oct 10 to Oct 11, potentially marking the development of wave E and G.
🔴 Support & Resistance Levels
4,369.17 and 4,227.06 are key horizontal price levels (likely S/R).
4,074.01 appears to be a final target for the bearish wave G.
Technical Analyst BY Passion
Clause de non-responsabilité
Les informations et les publications ne sont pas destinées à être, et ne constituent pas, des conseils ou des recommandations en matière de finance, d'investissement, de trading ou d'autres types de conseils fournis ou approuvés par TradingView. Pour en savoir plus, consultez les Conditions d'utilisation.