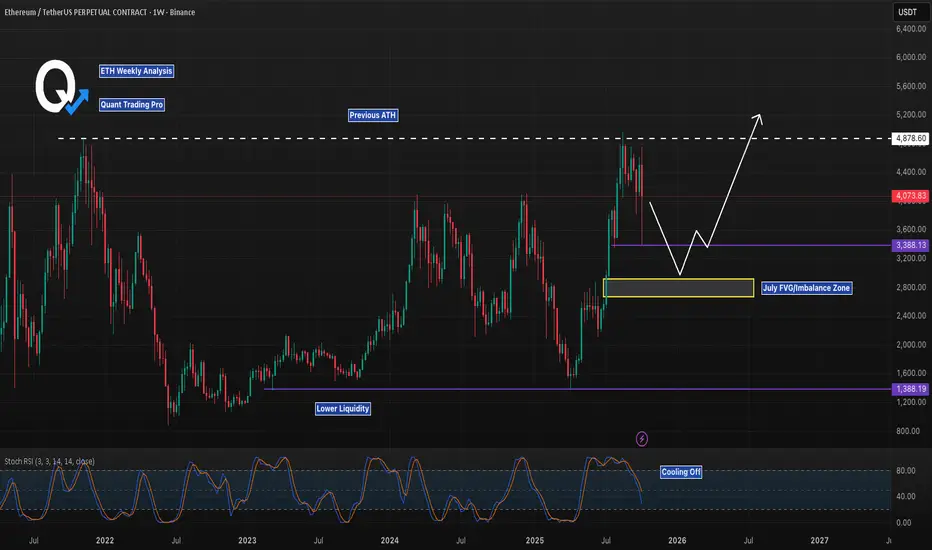
Ethereum (ETH/USD) on the weekly chart recently retested the July FVG imbalance zone around $3,388.13, showing a strong bounce after hitting lower liquidity near $1,600.00. The bullish scenario points to a potential move toward the previous ATH at $4,878.60 if momentum builds, especially with Stoch RSI cooling off from overbought levels. Conversely, watch for a bearish pullback if resistance holds at $3,388.13, targeting lower liquidity again—key levels to monitor are $3,388.13 and $1,600.00!
Explore 5,000 Strategies at quanttradingpro.com
Search for the most profitable, lowest risk by symbol!
Search by indicators like Supertrend, Ichimoku, macd.
Join our discord discord.gg/2systG9frc
We provide education & tools.
Search for the most profitable, lowest risk by symbol!
Search by indicators like Supertrend, Ichimoku, macd.
Join our discord discord.gg/2systG9frc
We provide education & tools.
Clause de non-responsabilité
Les informations et les publications ne sont pas destinées à être, et ne constituent pas, des conseils ou des recommandations en matière de finance, d'investissement, de trading ou d'autres types de conseils fournis ou approuvés par TradingView. Pour en savoir plus, consultez les Conditions d'utilisation.