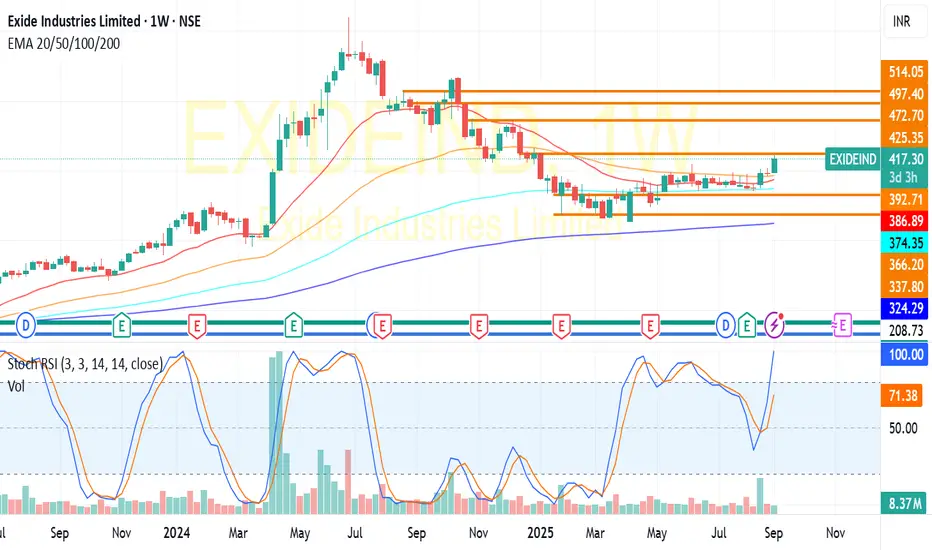
EXIDE IND:Trading above all its Moving average in daily and weekly charts.Golden cross over of DEMA in long term suggests a move towards 450,If it holds above 425 levels,my short term tgt would be 425 and mid term tgt is 450(for educational purpose only)
Clause de non-responsabilité
Les informations et publications ne sont pas destinées à être, et ne constituent pas, des conseils ou recommandations financiers, d'investissement, de trading ou autres fournis ou approuvés par TradingView. Pour en savoir plus, consultez les Conditions d'utilisation.
Clause de non-responsabilité
Les informations et publications ne sont pas destinées à être, et ne constituent pas, des conseils ou recommandations financiers, d'investissement, de trading ou autres fournis ou approuvés par TradingView. Pour en savoir plus, consultez les Conditions d'utilisation.