🔍 Technical Analysis Summary
📈 Trend and Price Action
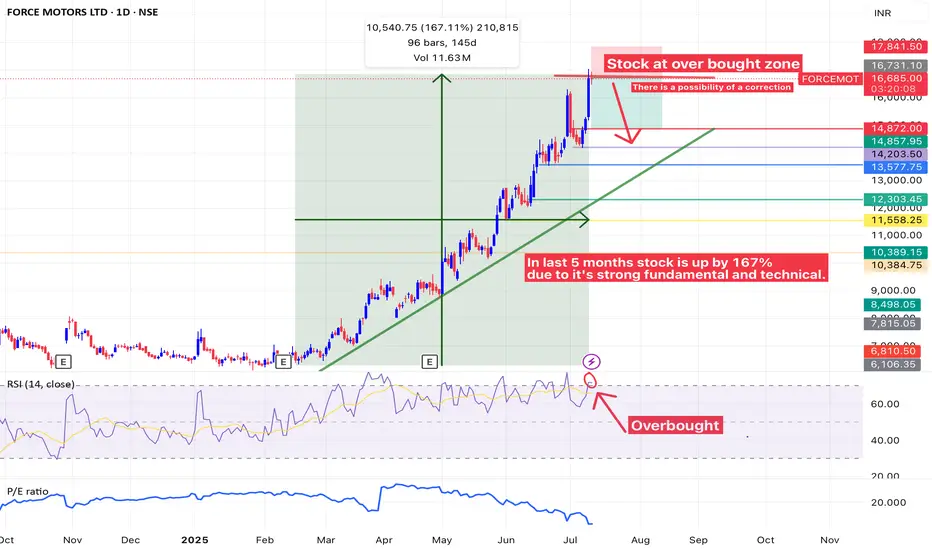
• The stock has shown strong bullish momentum, gaining 167.11% in the last 145 days (about 5 months).
• Price action is respecting a steep upward trendline, indicating persistent buying interest and a strong uptrend.
• Current Price: ₹16,731 (as shown)
• Significant resistance zone: Around ₹16,700–₹17,000 (price appears to be stalling here).
⸻
⚠️ Overbought Signal
• The RSI (Relative Strength Index, 14-period) is in the overbought zone (>70), currently indicating:
• Overextension of the rally.
• Possible short-term correction or consolidation phase ahead.
• The RSI also shows a bearish crossover, where the RSI line crosses below the signal line, which can signal weakening momentum.
⸻
🔻 Correction Possibility
• As noted on the chart: “There is a possibility of a correction.”
• The first potential support levels in case of a pullback:
• ₹14,872
• ₹14,857.95
• ₹14,203.50
• ₹13,577.75 (near the trendline support)
• Strong base zone: ₹12,303.45 – ₹12,000
These levels could serve as buy-on-dip zones for long-term investors if fundamentals remain intact.
⸻
📊 Volume and PE Ratio
• Volume seems steady but not spiking dramatically—indicating healthy participation, not euphoria.
• P/E Ratio line at the bottom appears to be falling slightly, which could mean:
• Earnings have improved or stock price growth is now slightly outpacing earnings.
⸻
📌 Key Observations
• ✅ Uptrend remains intact: No major breakdown of structure yet.
• ⚠️ Overbought condition: RSI and steep price rise warn of potential short-term correction.
• 🔄 Healthy retracement expected: As part of a bullish continuation pattern or to retest support zones.
• 📉 Bearish divergence potential: If RSI forms a lower high while price makes a higher high (not clearly visible yet).
⸻
📈 Final Verdict:
Short-term: Caution is advised. Wait for confirmation of a pullback or consolidation before entering new positions.
Medium to Long-term: Still bullish due to strong price action and fundamentals, but consider partial profit-booking or trailing stop losses.
⸻
Would you like a deeper analysis using Fibonacci retracement or want a target estimation after correction?
📈 Trend and Price Action
• The stock has shown strong bullish momentum, gaining 167.11% in the last 145 days (about 5 months).
• Price action is respecting a steep upward trendline, indicating persistent buying interest and a strong uptrend.
• Current Price: ₹16,731 (as shown)
• Significant resistance zone: Around ₹16,700–₹17,000 (price appears to be stalling here).
⸻
⚠️ Overbought Signal
• The RSI (Relative Strength Index, 14-period) is in the overbought zone (>70), currently indicating:
• Overextension of the rally.
• Possible short-term correction or consolidation phase ahead.
• The RSI also shows a bearish crossover, where the RSI line crosses below the signal line, which can signal weakening momentum.
⸻
🔻 Correction Possibility
• As noted on the chart: “There is a possibility of a correction.”
• The first potential support levels in case of a pullback:
• ₹14,872
• ₹14,857.95
• ₹14,203.50
• ₹13,577.75 (near the trendline support)
• Strong base zone: ₹12,303.45 – ₹12,000
These levels could serve as buy-on-dip zones for long-term investors if fundamentals remain intact.
⸻
📊 Volume and PE Ratio
• Volume seems steady but not spiking dramatically—indicating healthy participation, not euphoria.
• P/E Ratio line at the bottom appears to be falling slightly, which could mean:
• Earnings have improved or stock price growth is now slightly outpacing earnings.
⸻
📌 Key Observations
• ✅ Uptrend remains intact: No major breakdown of structure yet.
• ⚠️ Overbought condition: RSI and steep price rise warn of potential short-term correction.
• 🔄 Healthy retracement expected: As part of a bullish continuation pattern or to retest support zones.
• 📉 Bearish divergence potential: If RSI forms a lower high while price makes a higher high (not clearly visible yet).
⸻
📈 Final Verdict:
Short-term: Caution is advised. Wait for confirmation of a pullback or consolidation before entering new positions.
Medium to Long-term: Still bullish due to strong price action and fundamentals, but consider partial profit-booking or trailing stop losses.
⸻
Would you like a deeper analysis using Fibonacci retracement or want a target estimation after correction?
Clause de non-responsabilité
Les informations et les publications ne sont pas destinées à être, et ne constituent pas, des conseils ou des recommandations en matière de finance, d'investissement, de trading ou d'autres types de conseils fournis ou approuvés par TradingView. Pour en savoir plus, consultez les Conditions d'utilisation.