Hello 🐋
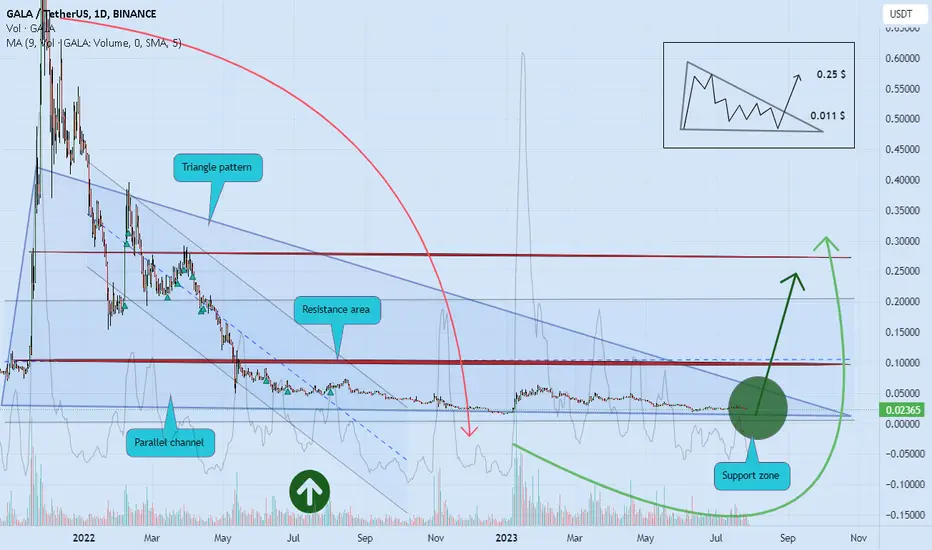
Based on the chart, the price is in the parallel channel and close to the channel support area, and triangle pattern ✔️
if
the price doesn't break the support zone to the downside, we will see more gain 💣🚀
otherwise
we can see more correction to lower support level ❌🧨
if
breakout of the upper resistance zone be completed, we can see more pump to the upside ✔️🚀
👌 Notice: pay attention to the price on shortcut chart (located below the main chart with black colour) 📖💡
Please, feel free to share your point of view, write it in the comments below, thanks 🐋
Educational plans & Free signals, all in telegram:
👉t.me/madwhalechannel
👉t.me/madwhalechannel
Clause de non-responsabilité
Les informations et publications ne sont pas destinées à être, et ne constituent pas, des conseils ou recommandations financiers, d'investissement, de trading ou autres fournis ou approuvés par TradingView. Pour en savoir plus, consultez les Conditions d'utilisation.