Today we will take a look at the Daily chart on GBPCHF.
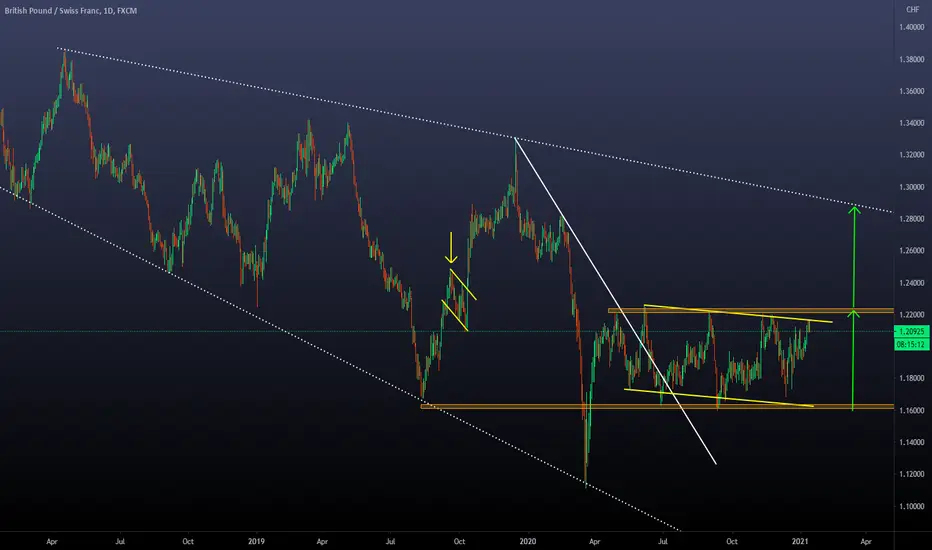
-The main structure we have is the expanding descending channel
-Inside the channel, we can see a range formed by the support zone at 1.16000 and the resistance zone at 1.22000
-Technical theory tells us that the expected movement after a breakout of a range is the extension of it. We can see that the extension provides a target that converges with the higher trendline of the descending channel
-If we have a breakout, we can expect to see a corrective structure with similar proportions to the one that happened before (yellow arrow) before the big bullish movement
-This is an interesting Forex Pair to keep an eye on due to the bullish potential it can provide if we have a breakout!
Clause de non-responsabilité
Les informations et publications ne sont pas destinées à être, et ne constituent pas, des conseils ou recommandations financiers, d'investissement, de trading ou autres fournis ou approuvés par TradingView. Pour en savoir plus, consultez les Conditions d'utilisation.
Clause de non-responsabilité
Les informations et publications ne sont pas destinées à être, et ne constituent pas, des conseils ou recommandations financiers, d'investissement, de trading ou autres fournis ou approuvés par TradingView. Pour en savoir plus, consultez les Conditions d'utilisation.