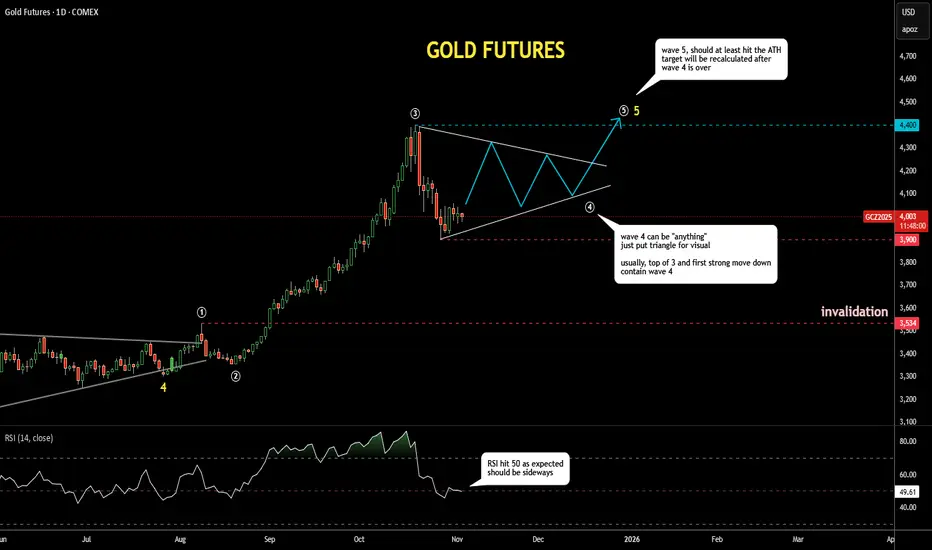
Gold futures dropped into the pink-box target area based on the Fibonacci retracement between $3,750 and $4,000.
As expected, the RSI has reached the 50 “waterline”, where it could find some support and start moving around that level.
Many traders lose money in fourth waves, as they can be “anything” and often last longer than one’s pocket. I’ve outlined a triangle shape in wave 4 just for visual context.
The range built through the peak of wave 3 around $4,400 and the bottom of recent panic selling near $3,900 will likely contain most of the volatility in wave 4.
It can take time… testing one’s patience.
Publications connexes
Clause de non-responsabilité
Les informations et les publications ne sont pas destinées à être, et ne constituent pas, des conseils ou des recommandations en matière de finance, d'investissement, de trading ou d'autres types de conseils fournis ou approuvés par TradingView. Pour en savoir plus, consultez les Conditions d'utilisation.