📌 Current Price Snapshot (as of latest trade)
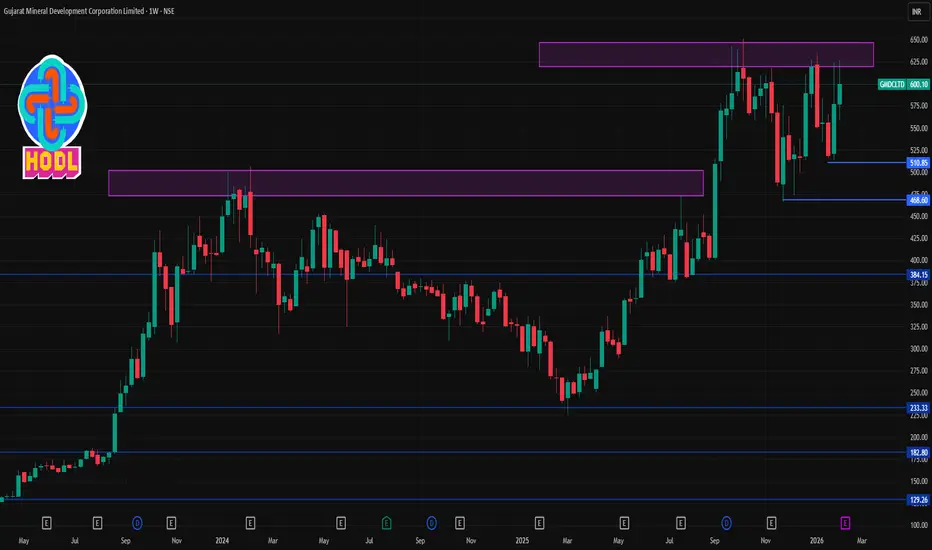
GMDCLTD price (NSE/BSE): ~₹600.1 — stock recently traded around ₹594–₹615 range during the session.
• 52-week high: ~₹651
• 52-week low: ~₹226.59
This places the stock well above its 52-week low and closer to recent highs, showing resilience on the weekly timeframe.
📊 Key Weekly/Short-Term Levels
🔹 Resistance (Upside Targets)
These are potential price ceilings where sellers might step in on a short-term bounce.
R1: ~₹626–₹628
R2: ~₹638–₹640
R3: ~₹650–₹661
A sustained weekly close above ~₹626 would be needed to affirm short-term bullish momentum. Breaking above ₹640+ opens room toward the recent ATH zone.
🔸 Support (Downside Floors)
These are key floors where the price may find buying interest if it dips.
S1: ~₹602
S2: ~₹573–₹575
S3: ~₹560
If price breaks below ₹602–₹590, watch ₹575/₹560 as deeper short-term supports. Sustained price above ~₹600 favors range support.
📌 Practical Levels for 1-Week Trading Window
Bullish scenario (buyers dominant):
➡ Price holds above ₹602–₹608 and moves toward ₹626–₹638 resistance.
Neutral / consolidation:
➡ Price oscillates between ₹590–₹620.
Bearish scenario (sellers dominant):
➡ Breaks below ₹602 and targets ₹575 / ₹560 zones.
Publications connexes
Clause de non-responsabilité
Les informations et publications ne sont pas destinées à être, et ne constituent pas, des conseils ou recommandations financiers, d'investissement, de trading ou autres fournis ou approuvés par TradingView. Pour en savoir plus, consultez les Conditions d'utilisation.