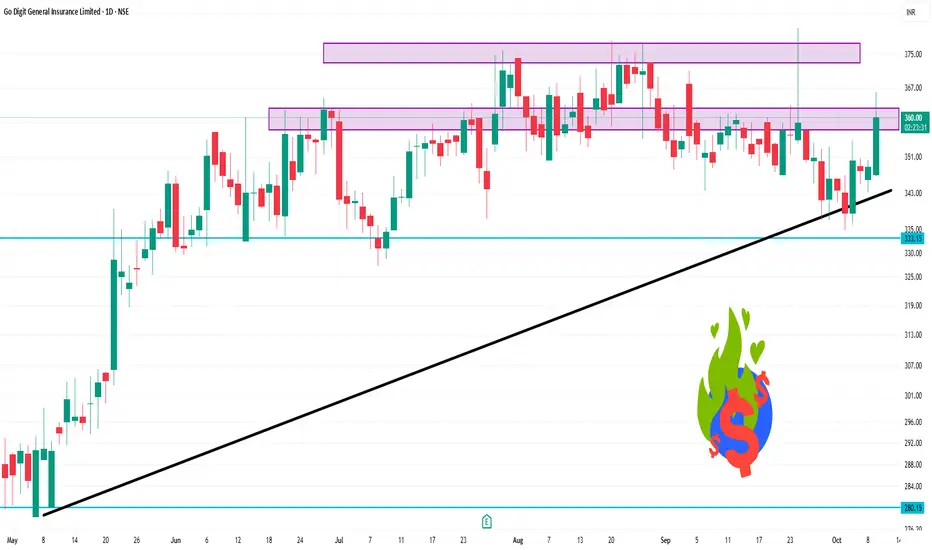
📊 Intraday Price Movement
Day’s Range: ₹346.65 – ₹350.15
Opening Price: ₹347.10
Closing Price (Previous Day): ₹348.80
Volume Traded: Approximately 55,201 shares
📈 Technical Indicators (1-Day Time Frame)
Relative Strength Index (RSI): 35.92 — indicates a neutral stance
Moving Averages:
5-Day EMA: ₹343.23 (Sell)
10-Day EMA: ₹346.88 (Sell)
20-Day EMA: ₹350.54 (Sell)
50-Day EMA: ₹351.97 (Sell)
100-Day EMA: ₹345.69 (Sell)
200-Day EMA: ₹334.59 (Buy)
MACD: -3.83 — suggests a potential buying opportunity
Commodity Channel Index (CCI): -206.91 — indicates a buying signal
Ultimate Oscillator: 28.51 — suggests a sell signal
Price Rate of Change (ROC): -5.88 — indicates a downward trend
🔍 Summary
The stock is exhibiting a neutral to slightly bearish trend in the short term, with several moving averages signaling a sell. However, indicators like MACD and CCI suggest potential buying opportunities. Investors should monitor for a sustained break above ₹350.00 for a more bullish outlook.
Publications connexes
Clause de non-responsabilité
Les informations et publications ne sont pas destinées à être, et ne constituent pas, des conseils ou recommandations financiers, d'investissement, de trading ou autres fournis ou approuvés par TradingView. Pour en savoir plus, consultez les Conditions d'utilisation.