🔹 Technical Analysis Of XAUUSD (GOLD)
▪️Chart Pattern: Head and Shoulders
▪️Pattern Breakdown
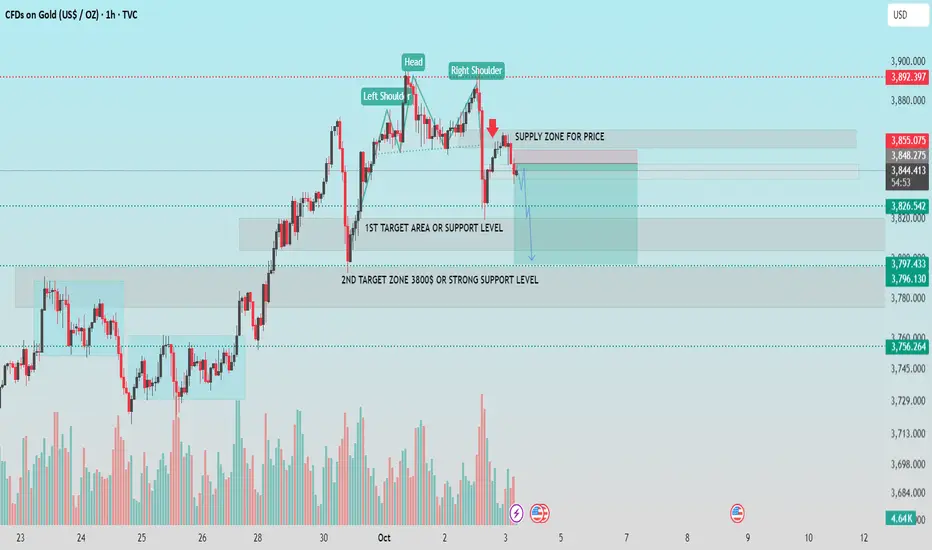
▫️ A Head and Shoulders pattern has formed, signaling a potential bearish reversal.
▫️ Left Shoulder: Formed around $3,848
▫️Head: Peaked near $3,870+
▫️Right Shoulder: Lower high, aligning with the left shoulder
This classic reversal pattern suggests a weakening bullish momentum and potential downside.
▪️Key Zones
▪️ Supply Zone for Price (Resistance):
$3,848 – $3,855
Price has already reacted from this zone, confirming selling pressure.
▫️ 1st Target Area / Support Level:
Around $3,826
Short-term support; if broken, further decline is likely.
▫️ 2nd Target Zone / Strong Support:
$3,796 – $3,780 range
A historically strong support zone and key demand area
▪️ Volume Analysis
Elevated volume during the right shoulder drop suggests increased selling interest, adding strength to the bearish signal.
▪️ Outlook
Bearish Bias favored unless price reclaims and closes above the supply zone.
Watch for a break below $3,826 for continuation towards $3,796 or lower.
If this helpful for you, press the like button.
▪️Chart Pattern: Head and Shoulders
▪️Pattern Breakdown
▫️ A Head and Shoulders pattern has formed, signaling a potential bearish reversal.
▫️ Left Shoulder: Formed around $3,848
▫️Head: Peaked near $3,870+
▫️Right Shoulder: Lower high, aligning with the left shoulder
This classic reversal pattern suggests a weakening bullish momentum and potential downside.
▪️Key Zones
▪️ Supply Zone for Price (Resistance):
$3,848 – $3,855
Price has already reacted from this zone, confirming selling pressure.
▫️ 1st Target Area / Support Level:
Around $3,826
Short-term support; if broken, further decline is likely.
▫️ 2nd Target Zone / Strong Support:
$3,796 – $3,780 range
A historically strong support zone and key demand area
▪️ Volume Analysis
Elevated volume during the right shoulder drop suggests increased selling interest, adding strength to the bearish signal.
▪️ Outlook
Bearish Bias favored unless price reclaims and closes above the supply zone.
Watch for a break below $3,826 for continuation towards $3,796 or lower.
If this helpful for you, press the like button.
Transaction en cours
from 3858, supply zoneNote
just hold your trades from supply zoneTrade fermée: ordre d’arrêt atteint
💸FREE FOREX Signals in Telegram : t.me/FxInsightsHub0
🔹Join Our Telegram Channel, Pure Price Action Based Signals With Chart Analysis.
t.me/FxInsightsHub0
🚀FREE CRYPTO Signals In Telegram: t.me/FxInsightsHub0
🔹Join Our Telegram Channel, Pure Price Action Based Signals With Chart Analysis.
t.me/FxInsightsHub0
🚀FREE CRYPTO Signals In Telegram: t.me/FxInsightsHub0
Publications connexes
Clause de non-responsabilité
Les informations et les publications ne sont pas destinées à être, et ne constituent pas, des conseils ou des recommandations en matière de finance, d'investissement, de trading ou d'autres types de conseils fournis ou approuvés par TradingView. Pour en savoir plus, consultez les Conditions d'utilisation.