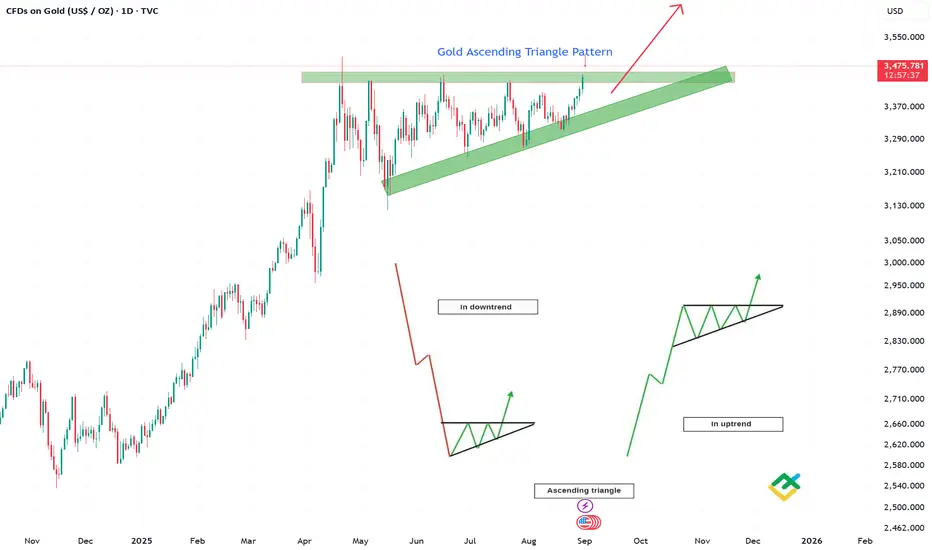
Gold is painting a compelling technical picture on the daily chart, consolidating within a clear Ascending Triangle pattern—a classic continuation signal that often breaks to the upside.
Pattern Structure:
Support: A rising trendline connecting higher lows, indicating consistent buying pressure at increasingly elevated levels.
Resistance: A horizontal barrier near the $3,477 - $3,550 zone, which has been tested multiple times, confirming its significance.
Key Levels:
Breakout Target: A successful breakout above $3,550 could trigger a measured move projection targeting $3,800+, based on the pattern's height.
Support to Hold: The pattern remains valid as long as price holds above the ascending support. A break below could invalidate the setup and signal a deeper pullback.
Volume & Momentum:
The formation of higher lows suggests accumulation and weakening selling pressure at key resistance.
A breakout accompanied by rising volume would strongly confirm bullish momentum.
Macro Context:
This pattern forms within a larger uptrend, reinforcing its reliability. Gold's role as a safe-haven asset amid global economic uncertainty continues to underpin demand.
Trading Outlook:
Bulls should await a decisive close above $3,550 to enter, targeting new all-time highs.
Bears need a break below the ascending trendline to regain control.
Trade fermée manuellement
Clause de non-responsabilité
Les informations et publications ne sont pas destinées à être, et ne constituent pas, des conseils ou recommandations financiers, d'investissement, de trading ou autres fournis ou approuvés par TradingView. Pour en savoir plus, consultez les Conditions d'utilisation.
Clause de non-responsabilité
Les informations et publications ne sont pas destinées à être, et ne constituent pas, des conseils ou recommandations financiers, d'investissement, de trading ou autres fournis ou approuvés par TradingView. Pour en savoir plus, consultez les Conditions d'utilisation.