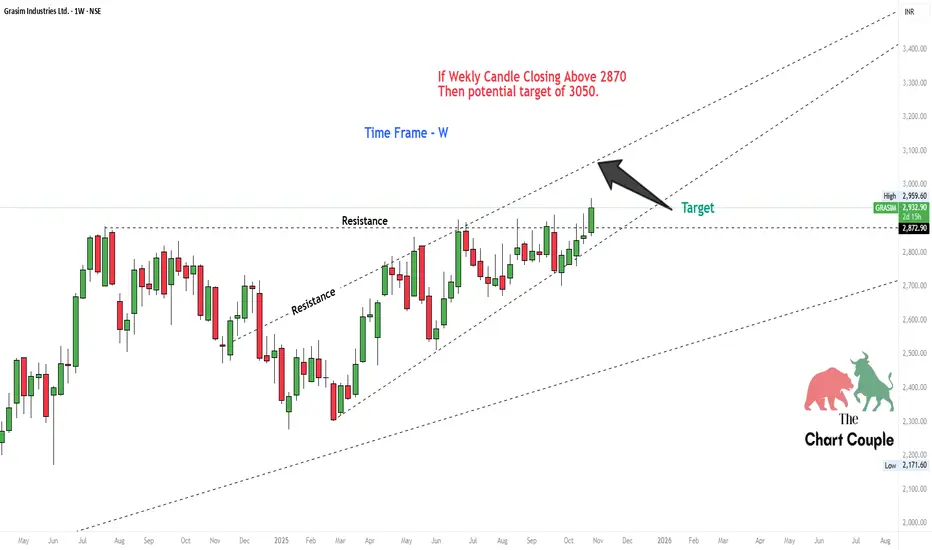
The stock is showing strong momentum within its rising channel!
📈 Key Level to Watch:
If the weekly candle closes above 2870, it could open the gates toward a potential target of 3050.
🧠 Technical View:
Price breaking past resistance zone
Volume confirmation could add strength
Trend remains bullish within channel
⚠️ Keep an eye on the weekly close — a confirmed breakout can bring solid upside momentum!
💬 What’s your view on GRASIM’s next move — breakout or pullback?
#grasim #technicalanalysis #stockmarketindia #nifty50 #priceactiontrading #thechartcouple #indianstocks #chartanalysis #stockbreakout #tradingview #swingtrading #marketanalysis
Clause de non-responsabilité
Les informations et publications ne sont pas destinées à être, et ne constituent pas, des conseils ou recommandations financiers, d'investissement, de trading ou autres fournis ou approuvés par TradingView. Pour en savoir plus, consultez les Conditions d'utilisation.
Clause de non-responsabilité
Les informations et publications ne sont pas destinées à être, et ne constituent pas, des conseils ou recommandations financiers, d'investissement, de trading ou autres fournis ou approuvés par TradingView. Pour en savoir plus, consultez les Conditions d'utilisation.