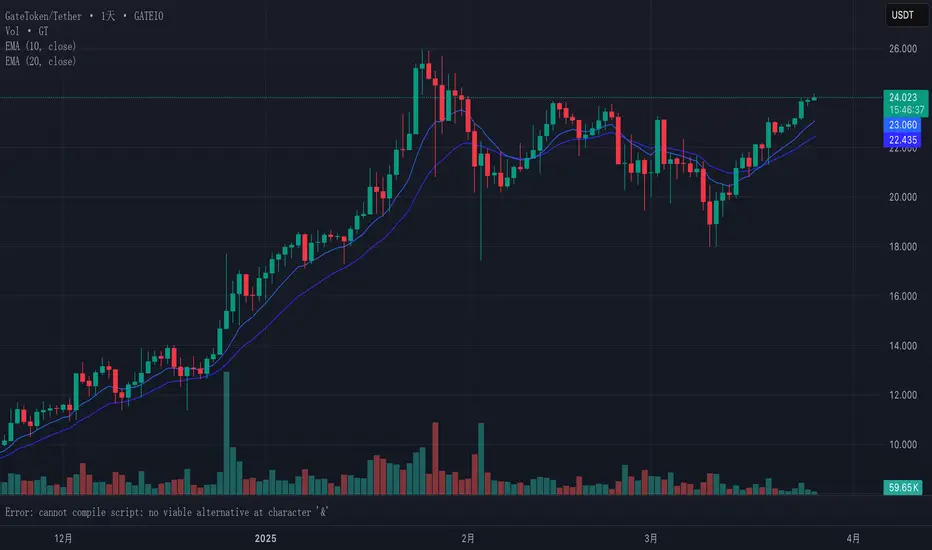
Since the significant dip in mid-March (below 19 USDT), GT has consistently formed higher lows – first around 20 USDT, then above 21 USDT, and recently maintaining levels above the EMAs. This pattern of ascending lows is a strong technical indicator of an underlying bullish sentiment, showing that buyers are becoming more aggressive at progressively higher prices, supporting the case for continued appreciation.
Clause de non-responsabilité
Les informations et publications ne sont pas destinées à être, et ne constituent pas, des conseils ou recommandations financiers, d'investissement, de trading ou autres fournis ou approuvés par TradingView. Pour en savoir plus, consultez les Conditions d'utilisation.
Clause de non-responsabilité
Les informations et publications ne sont pas destinées à être, et ne constituent pas, des conseils ou recommandations financiers, d'investissement, de trading ou autres fournis ou approuvés par TradingView. Pour en savoir plus, consultez les Conditions d'utilisation.