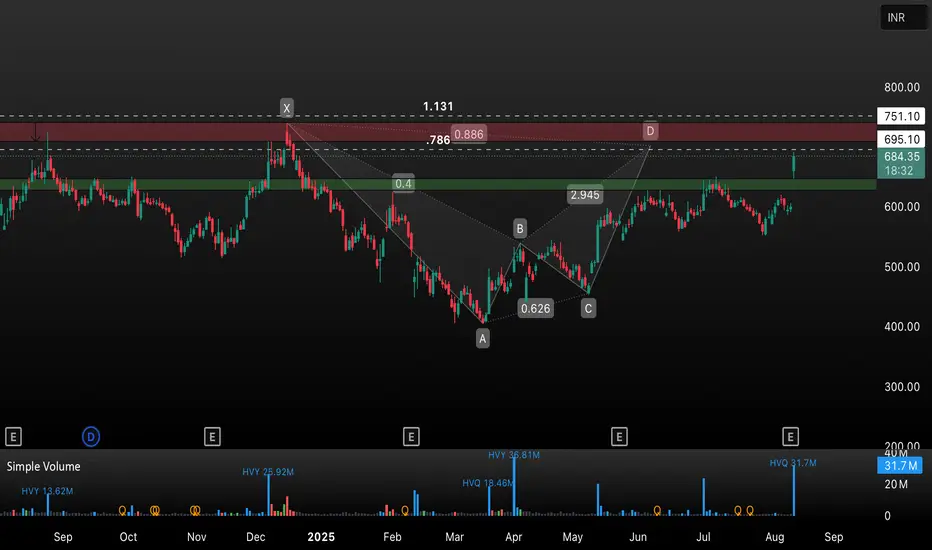
HB LENG has demonstrated a strong bullish breakout, surging over 13% and breaking past previous resistance. The chart displays a completed harmonic pattern with the price moving towards the D point zone (751 level). Key resistance lies between 695 – 751, with Fibonacci levels (.786/.886) as potential reversal zones.
Trade Insight:
• Support: 620–695 (green zone)
• Resistance: 695–751 (red zone)
• Watch for price action near the 751 zone; a breakout could trigger a fresh uptrend, while rejection may see consolidation or pullback.
• High volume confirms strong buyer interest.
Strategy:
Consider booking partial profits as price approaches resistance. Wait for confirmation before entering new positions. Ideal for swing traders watching for breakout or reversal signs.
Clause de non-responsabilité
Les informations et les publications ne sont pas destinées à être, et ne constituent pas, des conseils ou des recommandations en matière de finance, d'investissement, de trading ou d'autres types de conseils fournis ou approuvés par TradingView. Pour en savoir plus, consultez les Conditions d'utilisation.