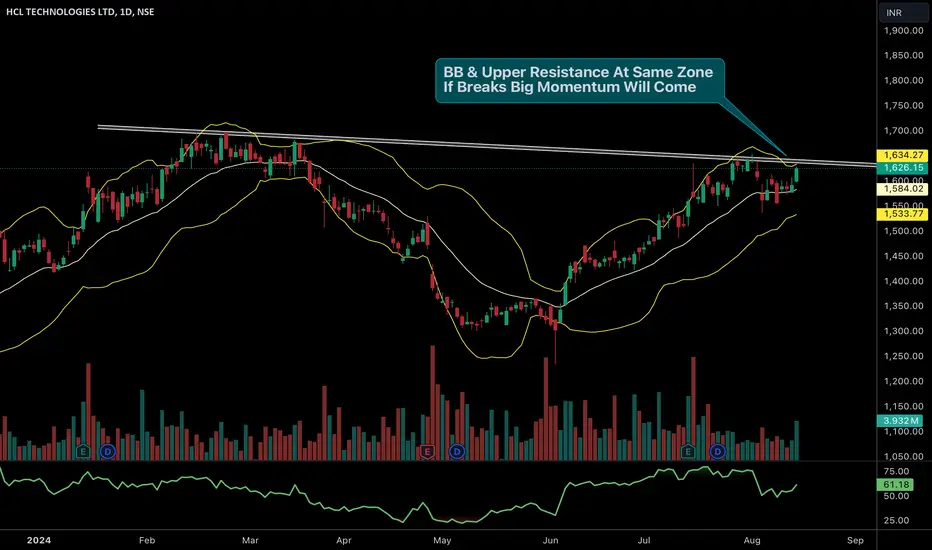
✅ HCL Tech has been consolidating near its upper resistance zone, where both the Bollinger Bands and trendline resistance align. This zone around ₹1630-1650 is crucial as a breakout above this level could trigger significant momentum.
✅ The stock is showing strength, moving along the upper Bollinger Band, which often precedes a breakout when combined with rising volumes.
✅ Watch for a breakout above the ₹1650 level. If the stock sustains above this zone, it could see a sharp upside move. However, failure to break this resistance may lead to a pullback towards the middle Bollinger Band and support around ₹1550-1600.
Join our community in telegram for real time updates --- telegram.me/marketiik
Telegram- telegram.me/marketiik
A simple trader, distancing from the fake crowd. Simplifying complexity, I prioritize genuine insights over trends.
Telegram- telegram.me/marketiik
A simple trader, distancing from the fake crowd. Simplifying complexity, I prioritize genuine insights over trends.
Clause de non-responsabilité
Les informations et publications ne sont pas destinées à être, et ne constituent pas, des conseils ou recommandations financiers, d'investissement, de trading ou autres fournis ou approuvés par TradingView. Pour en savoir plus, consultez les Conditions d'utilisation.